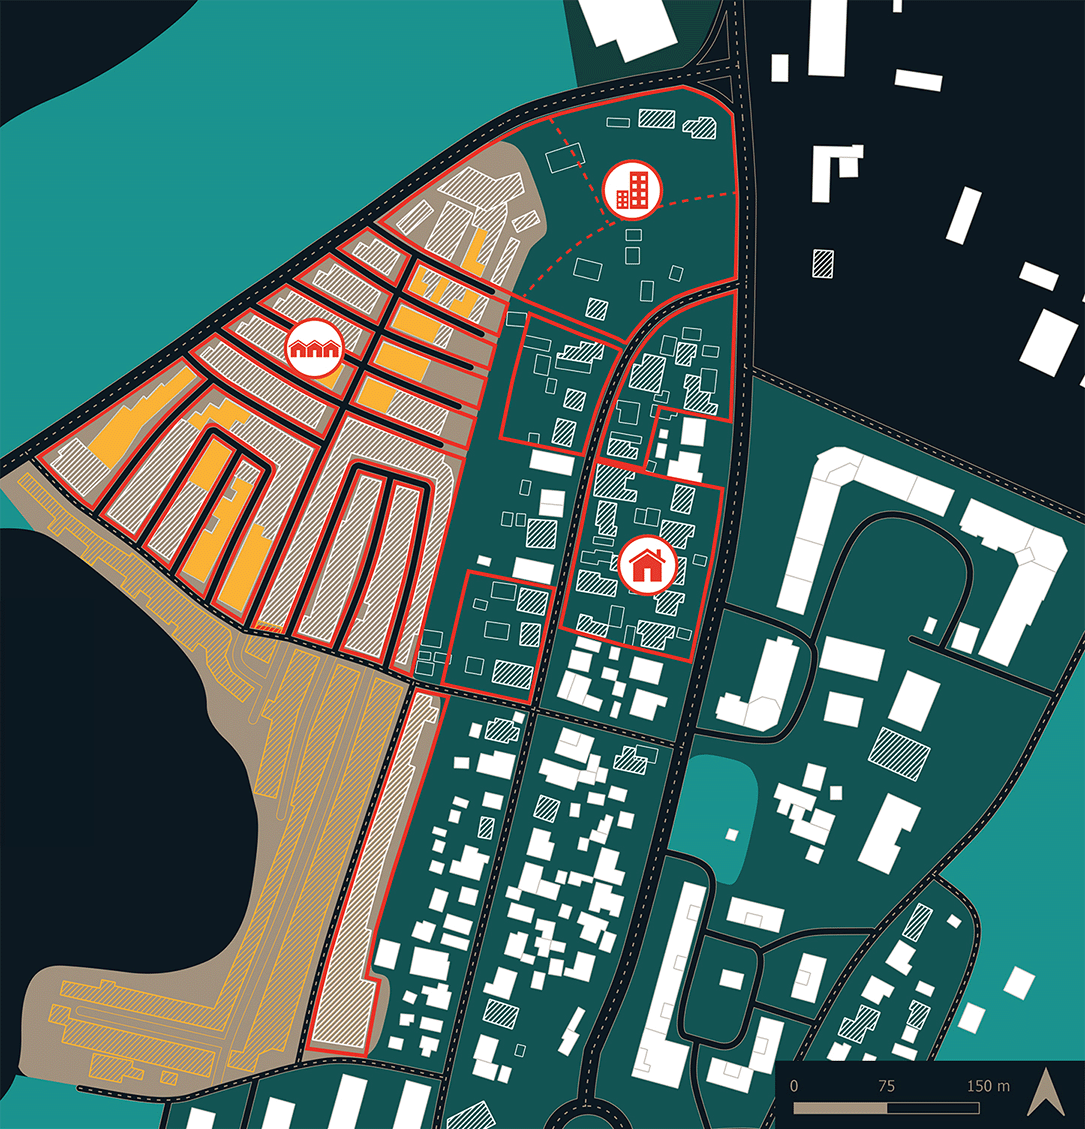
In the previous article I showed the preliminary analysis, which led me to a decision of creating this Blender Geometry Nodes parametric tool. In this article I will describe the logic behind the setup´s generative process and steps I undertook in order to develop Buildings & Streets Generator (BSG). At the end of the article you´ll find a user guide and documents for download.
Finding the right software
For people, who can´t write a single line of code but still need to create a script which outputs geometry, visual programming method is the best option. The most popular software that have implemented it are Rhino with its Grasshopper extension and Blender with its Geometry Nodes modifier. After considering pros and cons of both, the decision in favor of Blender was easy to make, even though I wasn´t experienced with this program yet. The fact that it´s a free open source software means that the script can be easily accessible for literally everyone interested in it. It reduces the barrier for potential users of starting to work with it. In addition, I discovered that Blender community is huge: open source enthusiasts from around the world together contribute to making this program better. They often share advice and tutorials, as well as different assets and pieces of their visual code on designated forums and online marketplaces, which makes it easier for beginners to get started with Blender.
Geometry nodes
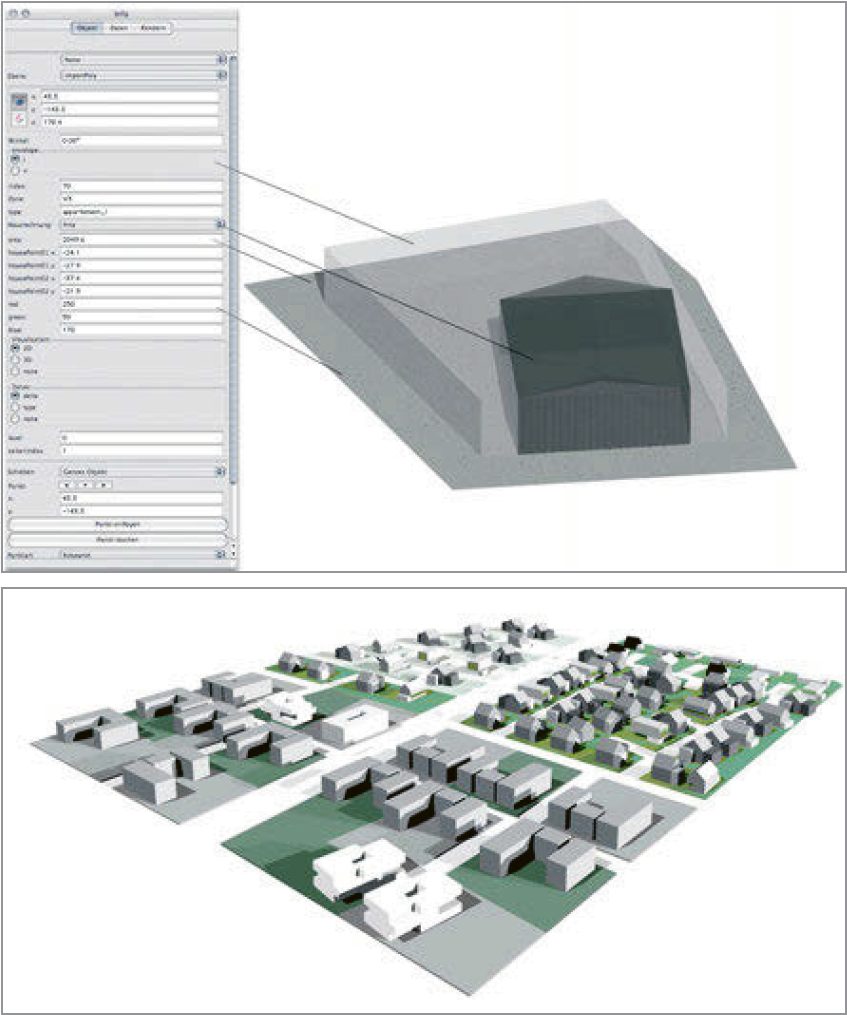
With Blender Geometry Nodes, it is possible to “pre-record“ certain steps of modifying geometry and apply them to different contexts. It is a very powerful tool, the complexity of which is unlimited. It was designed for setting and controlling parameters of geometry without deleting its previous versions (parametric non-destructive design). The nodes are easy to replicate, share between the files and for a non-programmer they are way easier to understand than any programming language.
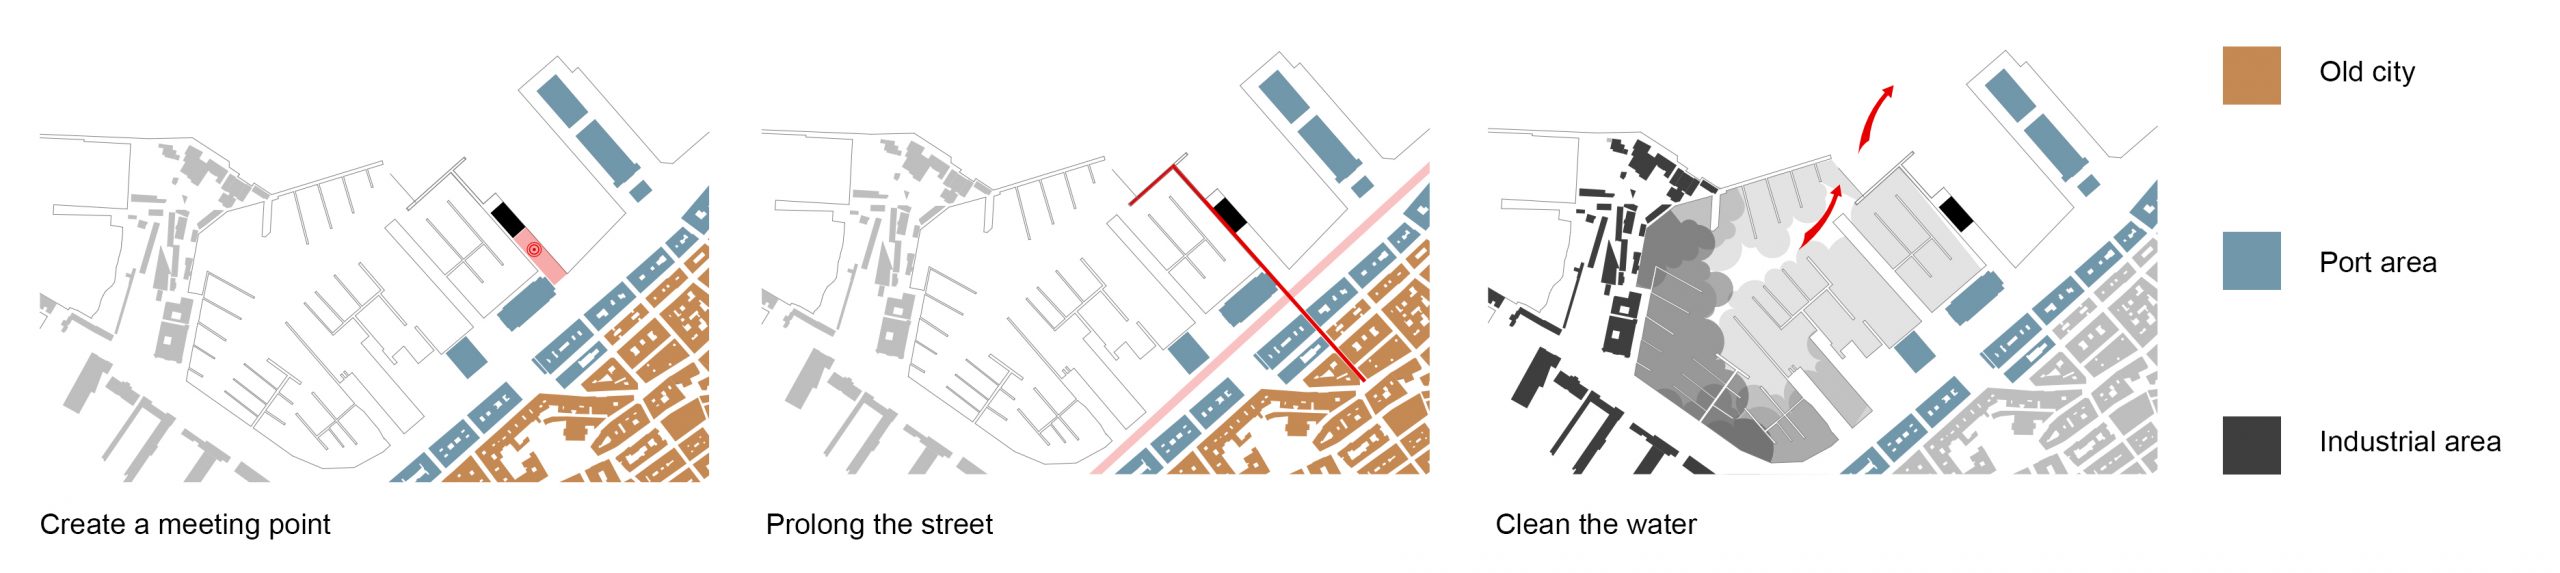
Dissecting urban space
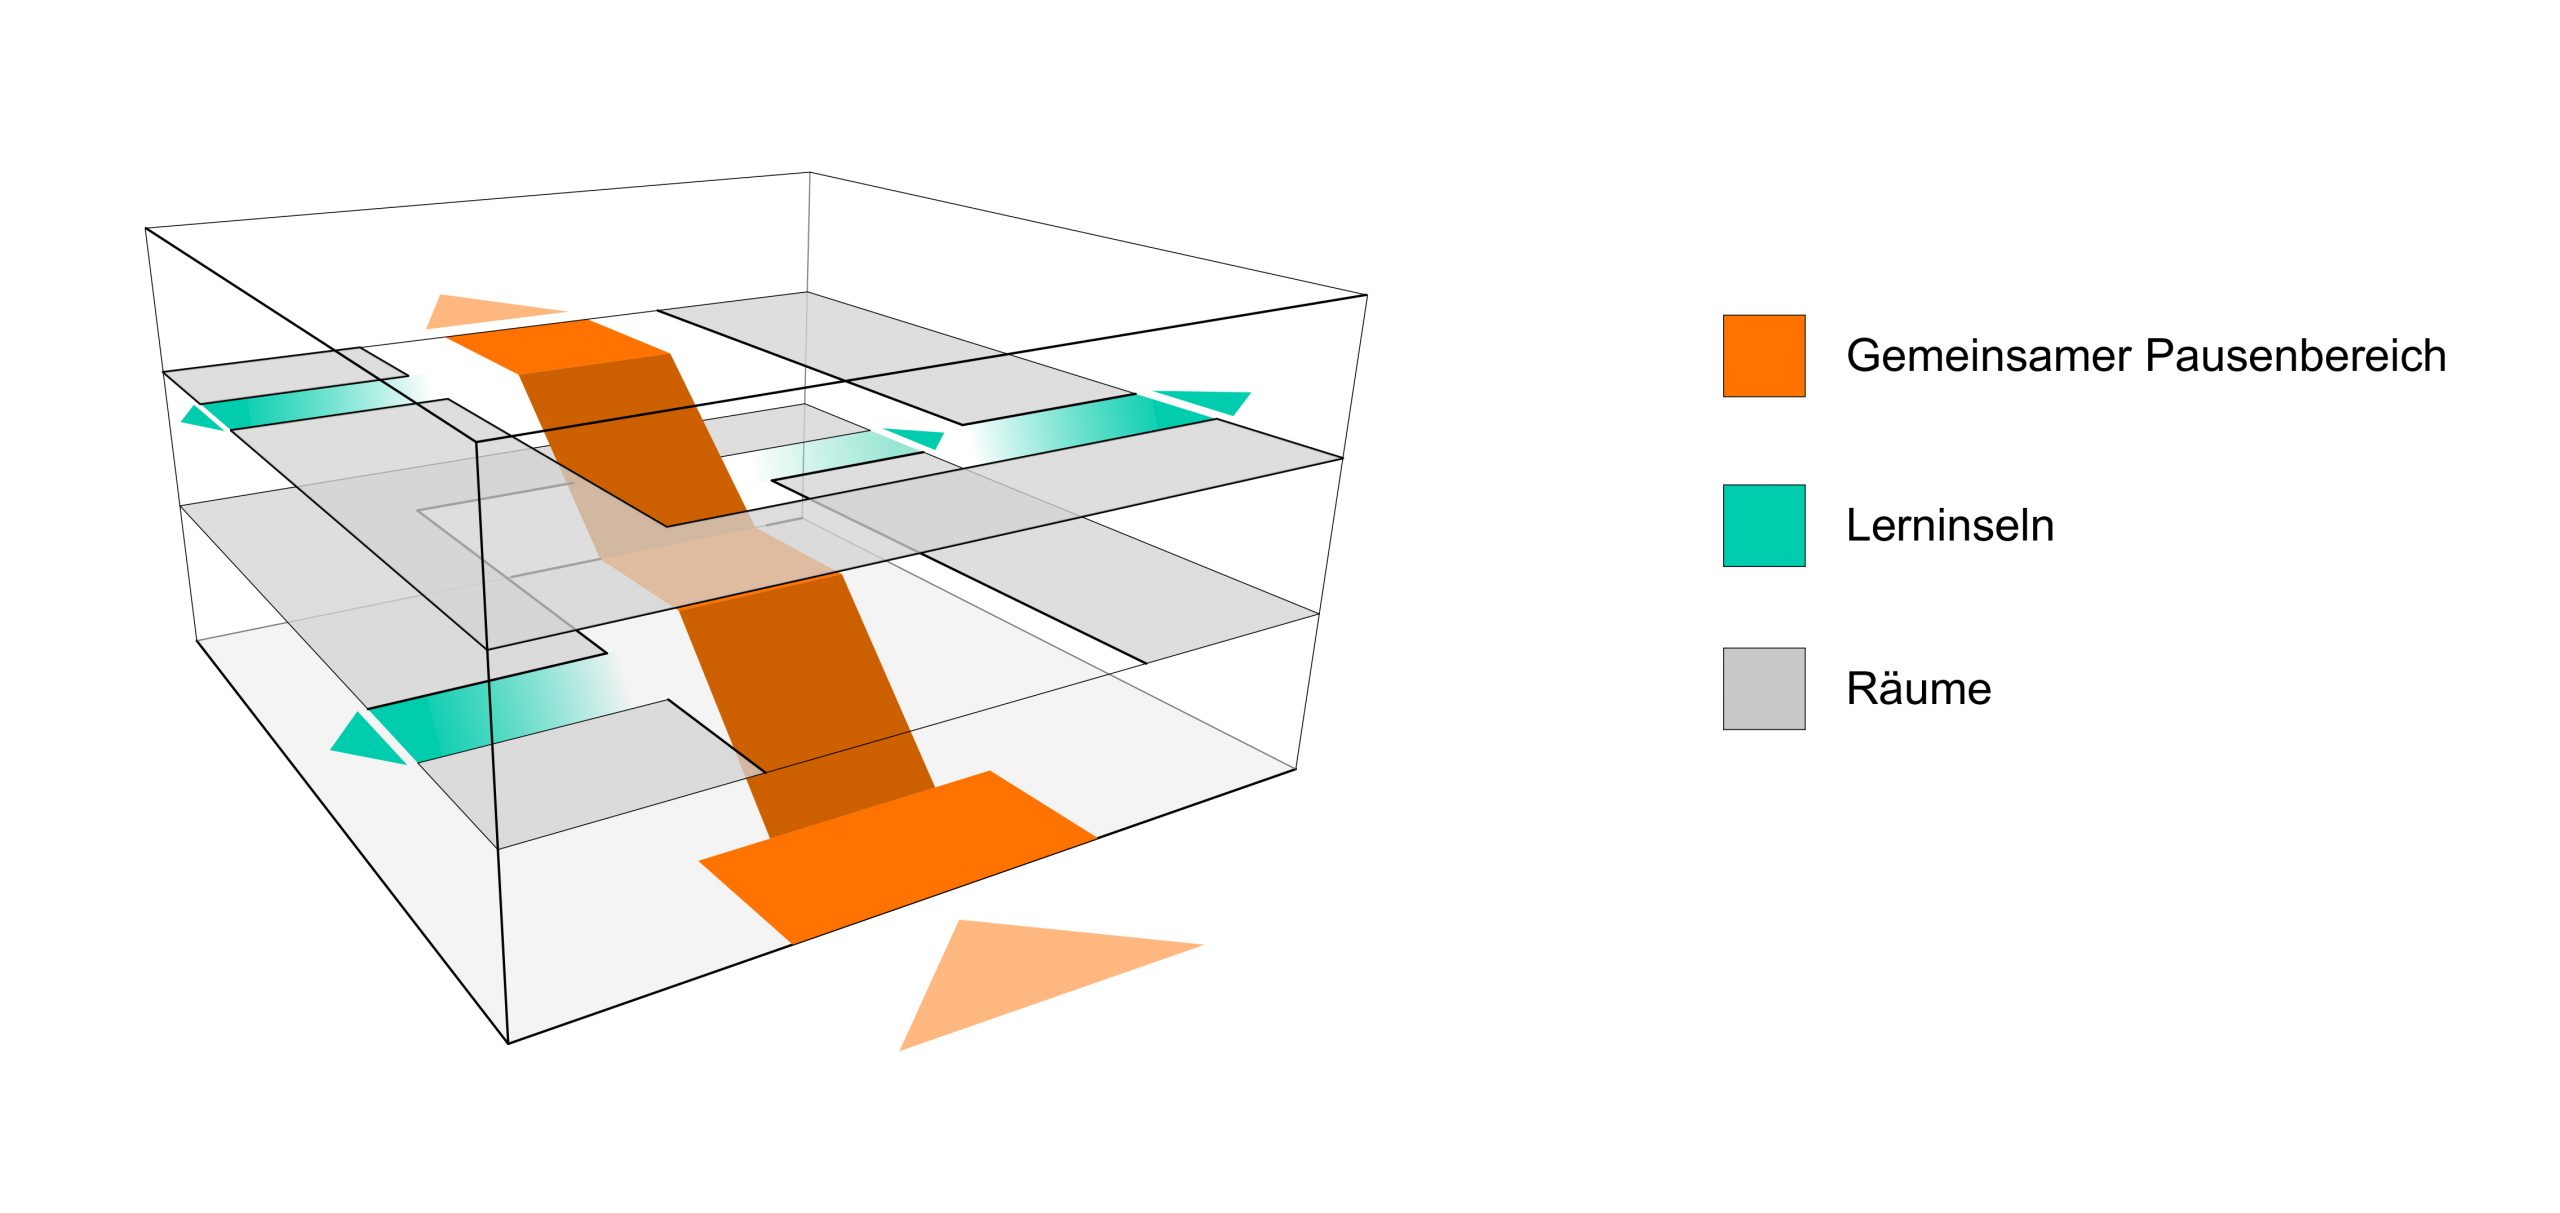
In order to create a script that is capable of generating different plausible solutions for residential areas, one should be aware of how the single elements of built structure are related to each other. It´s like assembling a puzzle: to create a nice picture, you have to take a look at each element and consciously put every single piece in its place.
But in order to assemble a picture, i had to disassemble built structure into the most important elemets first and due to the time limitations, only focus on the most important ones. What are the most important features of the street or of the building? What is the relationship between them? What do I have as an input and which steps do I have to take to achieve a desired output? In which order do I have to take those steps? These are typical questions everyone askes themselves while working on a parametric model.
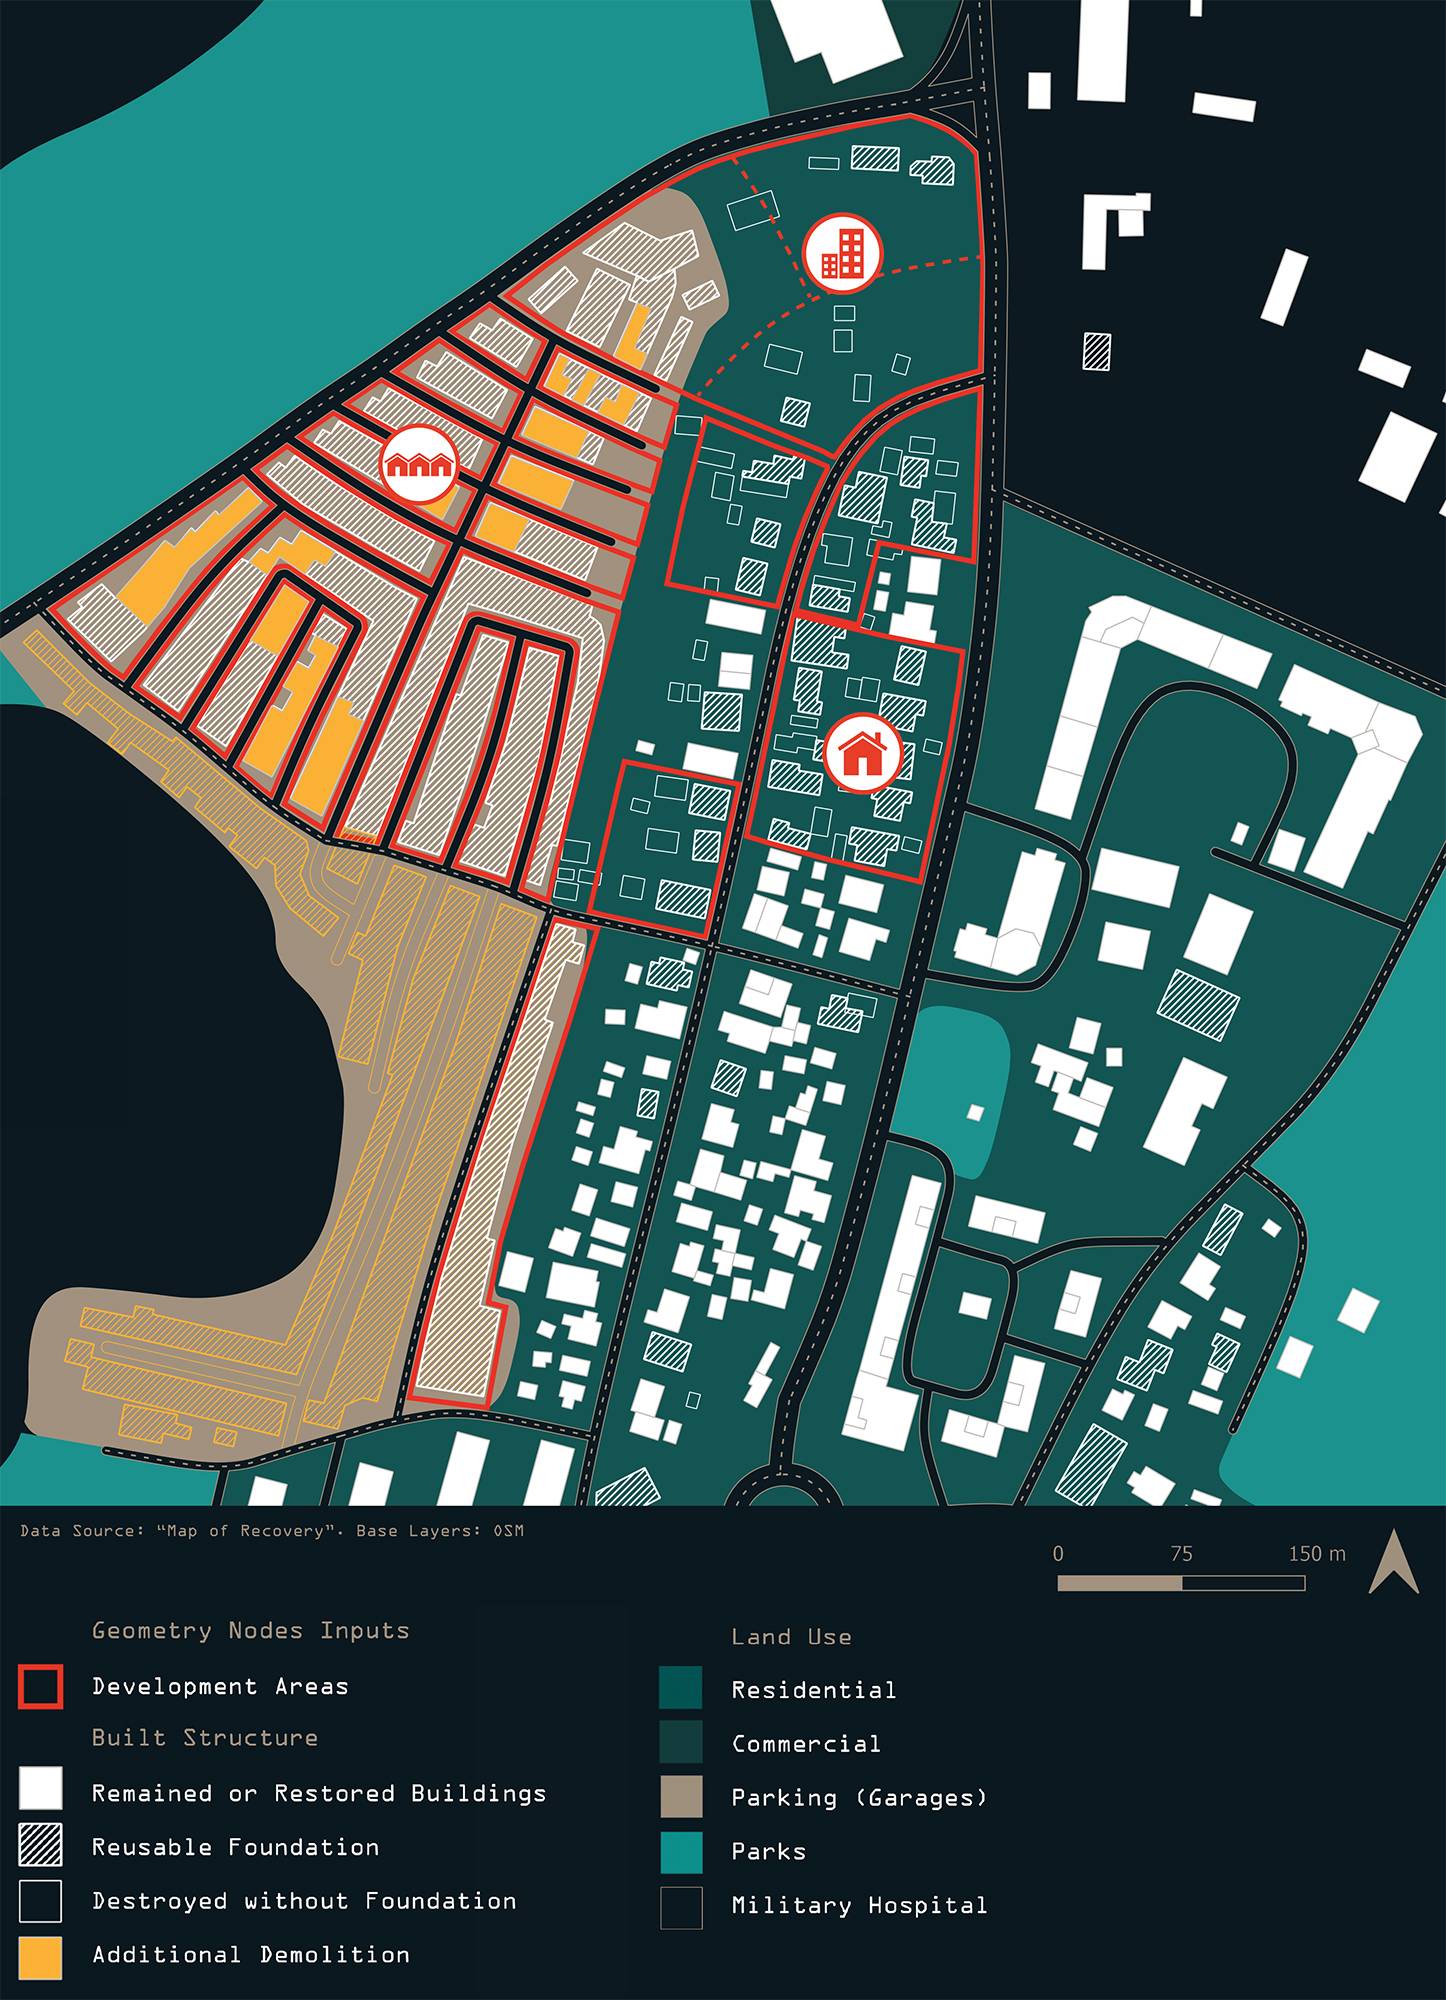
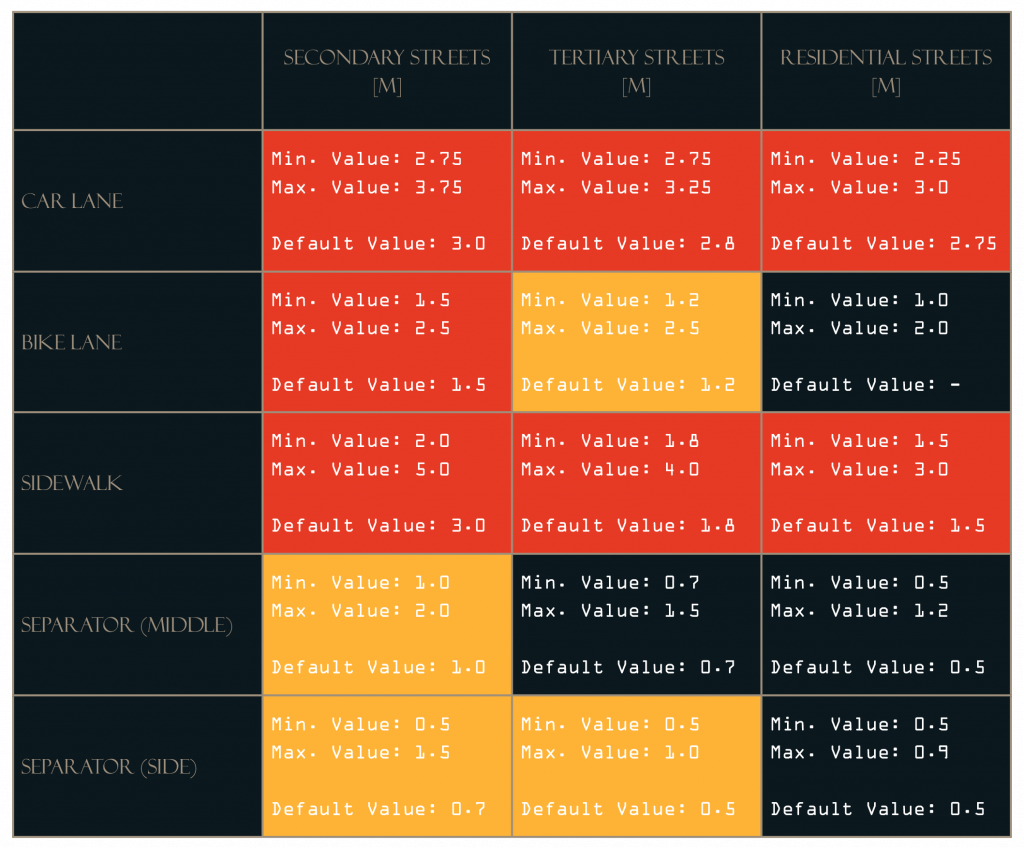
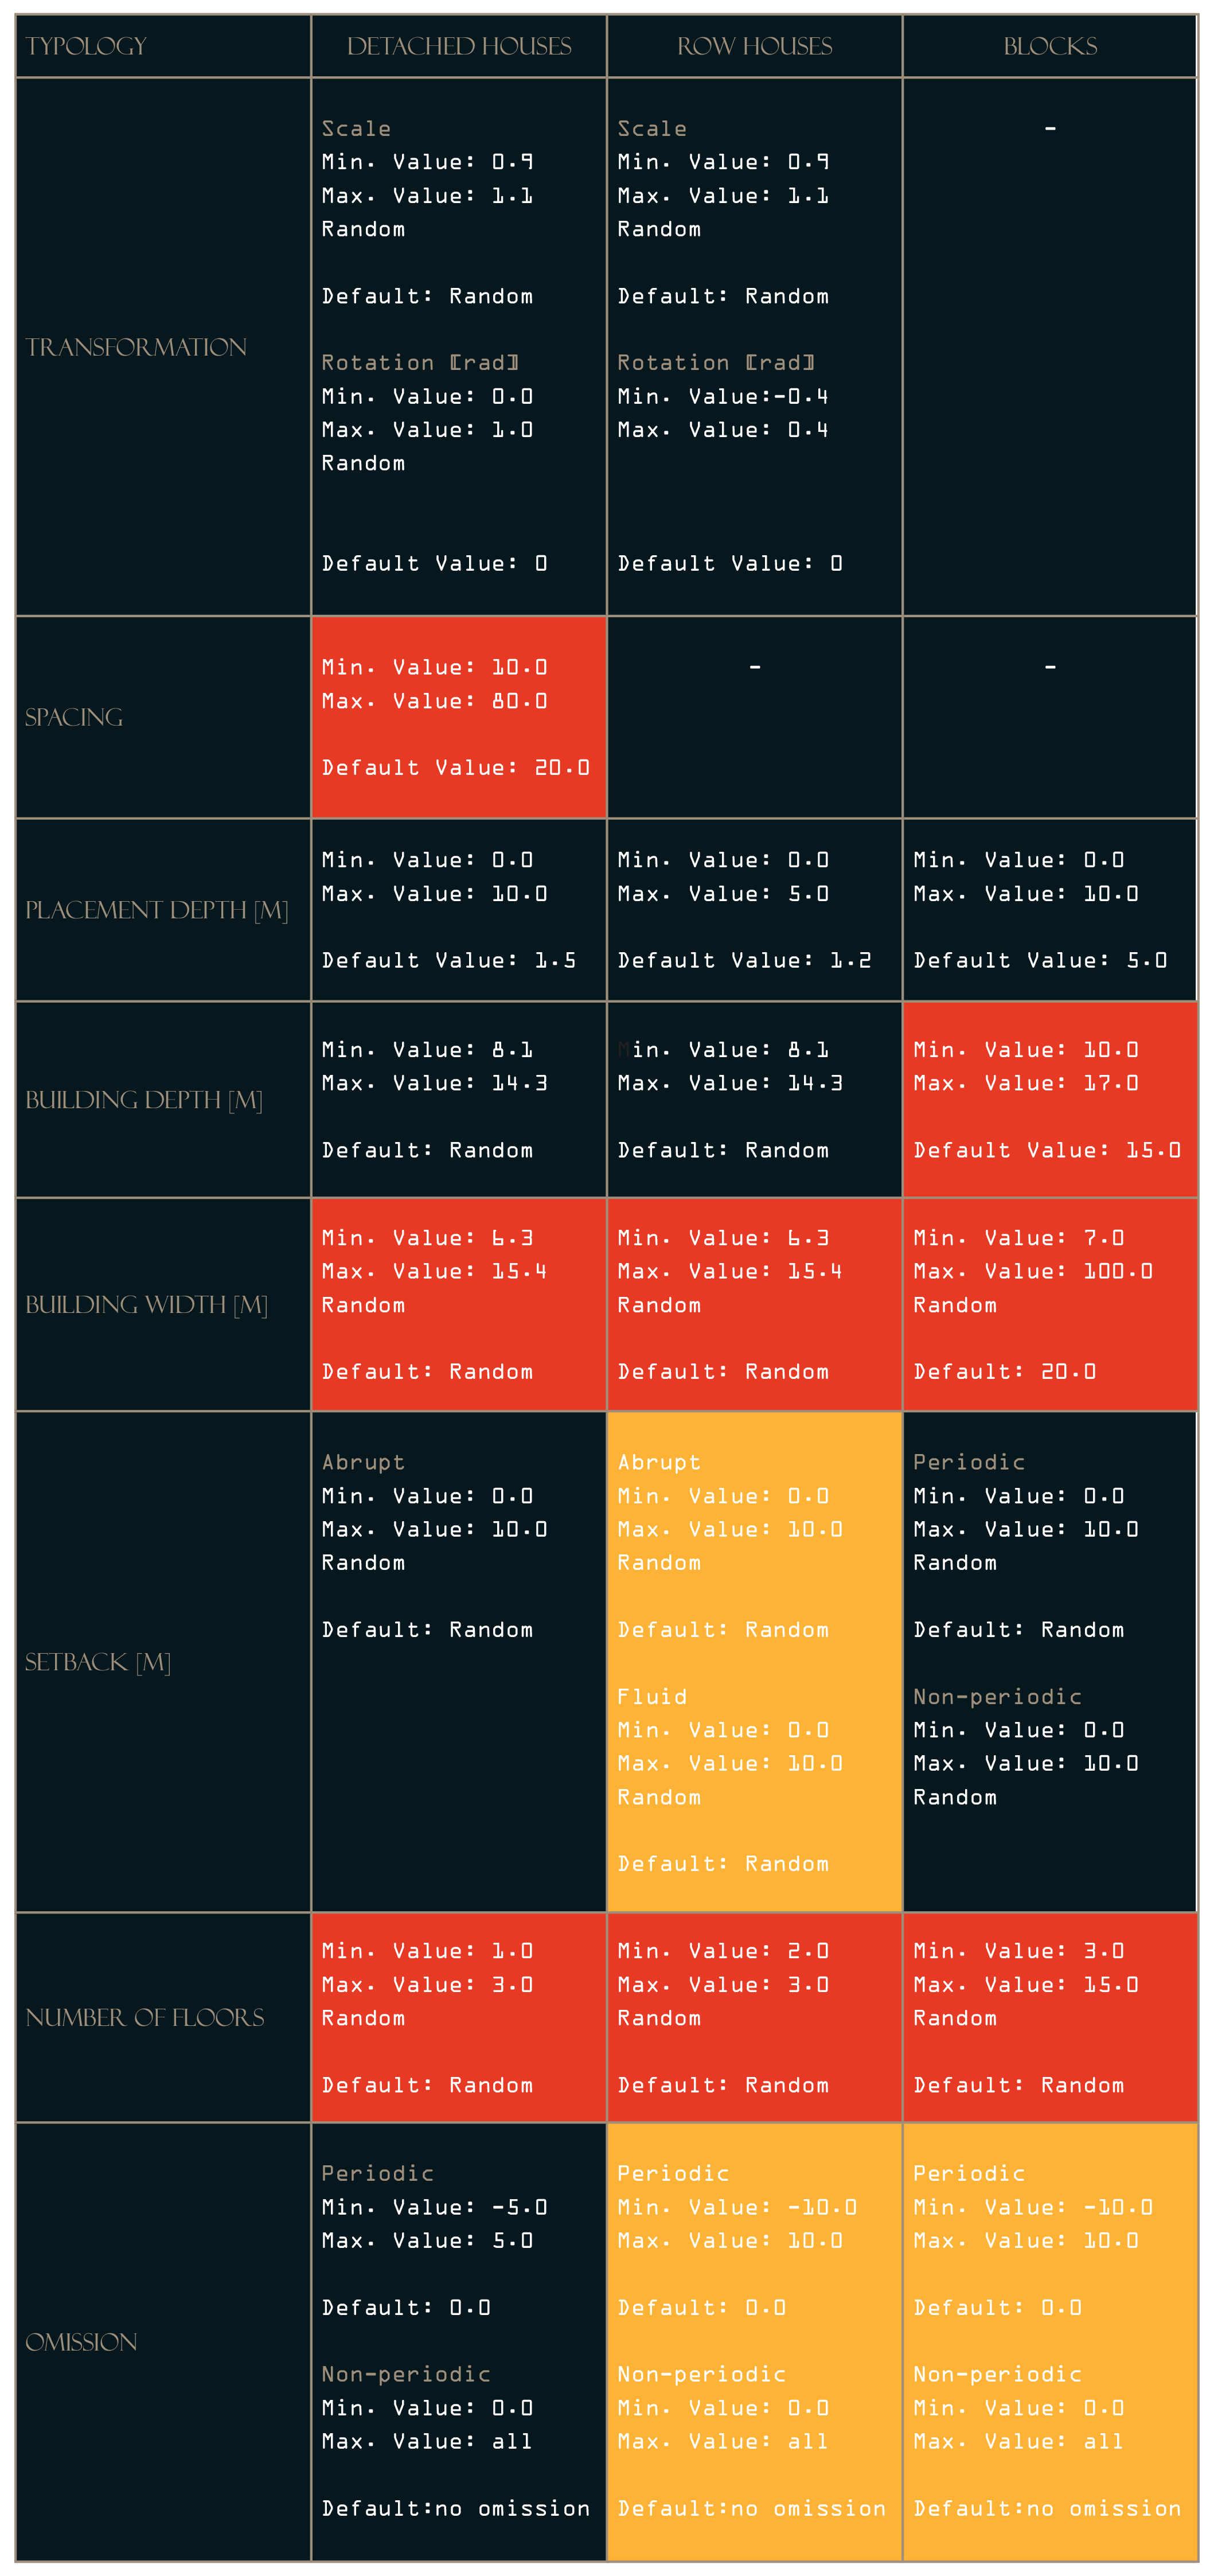
Much helpful theory has been written about the characteristics of good built structures. Authors such as Kevin Lynch, Christopher Alexander have devoted their work to the study of the relationship between them. Ernst Neufert, along with contemporary authors and professors Leonhard Schenk and Christa Reicher, have given much thought to the appropriate dimensions and spacing between these elements and have been a tremendous source of knowledge for me. This knowledge has been used as the basis for defining minimum and maximum values for the features that my script deals with, which are shown in Tables 1 and 2 for road elements and building elements respectively.
Defining inputs and outputs
Inputs
For the sake of simplicity in terms of usage, I tried to keep required inputs as simple as possible. Everything one needs to start working with BSG is:
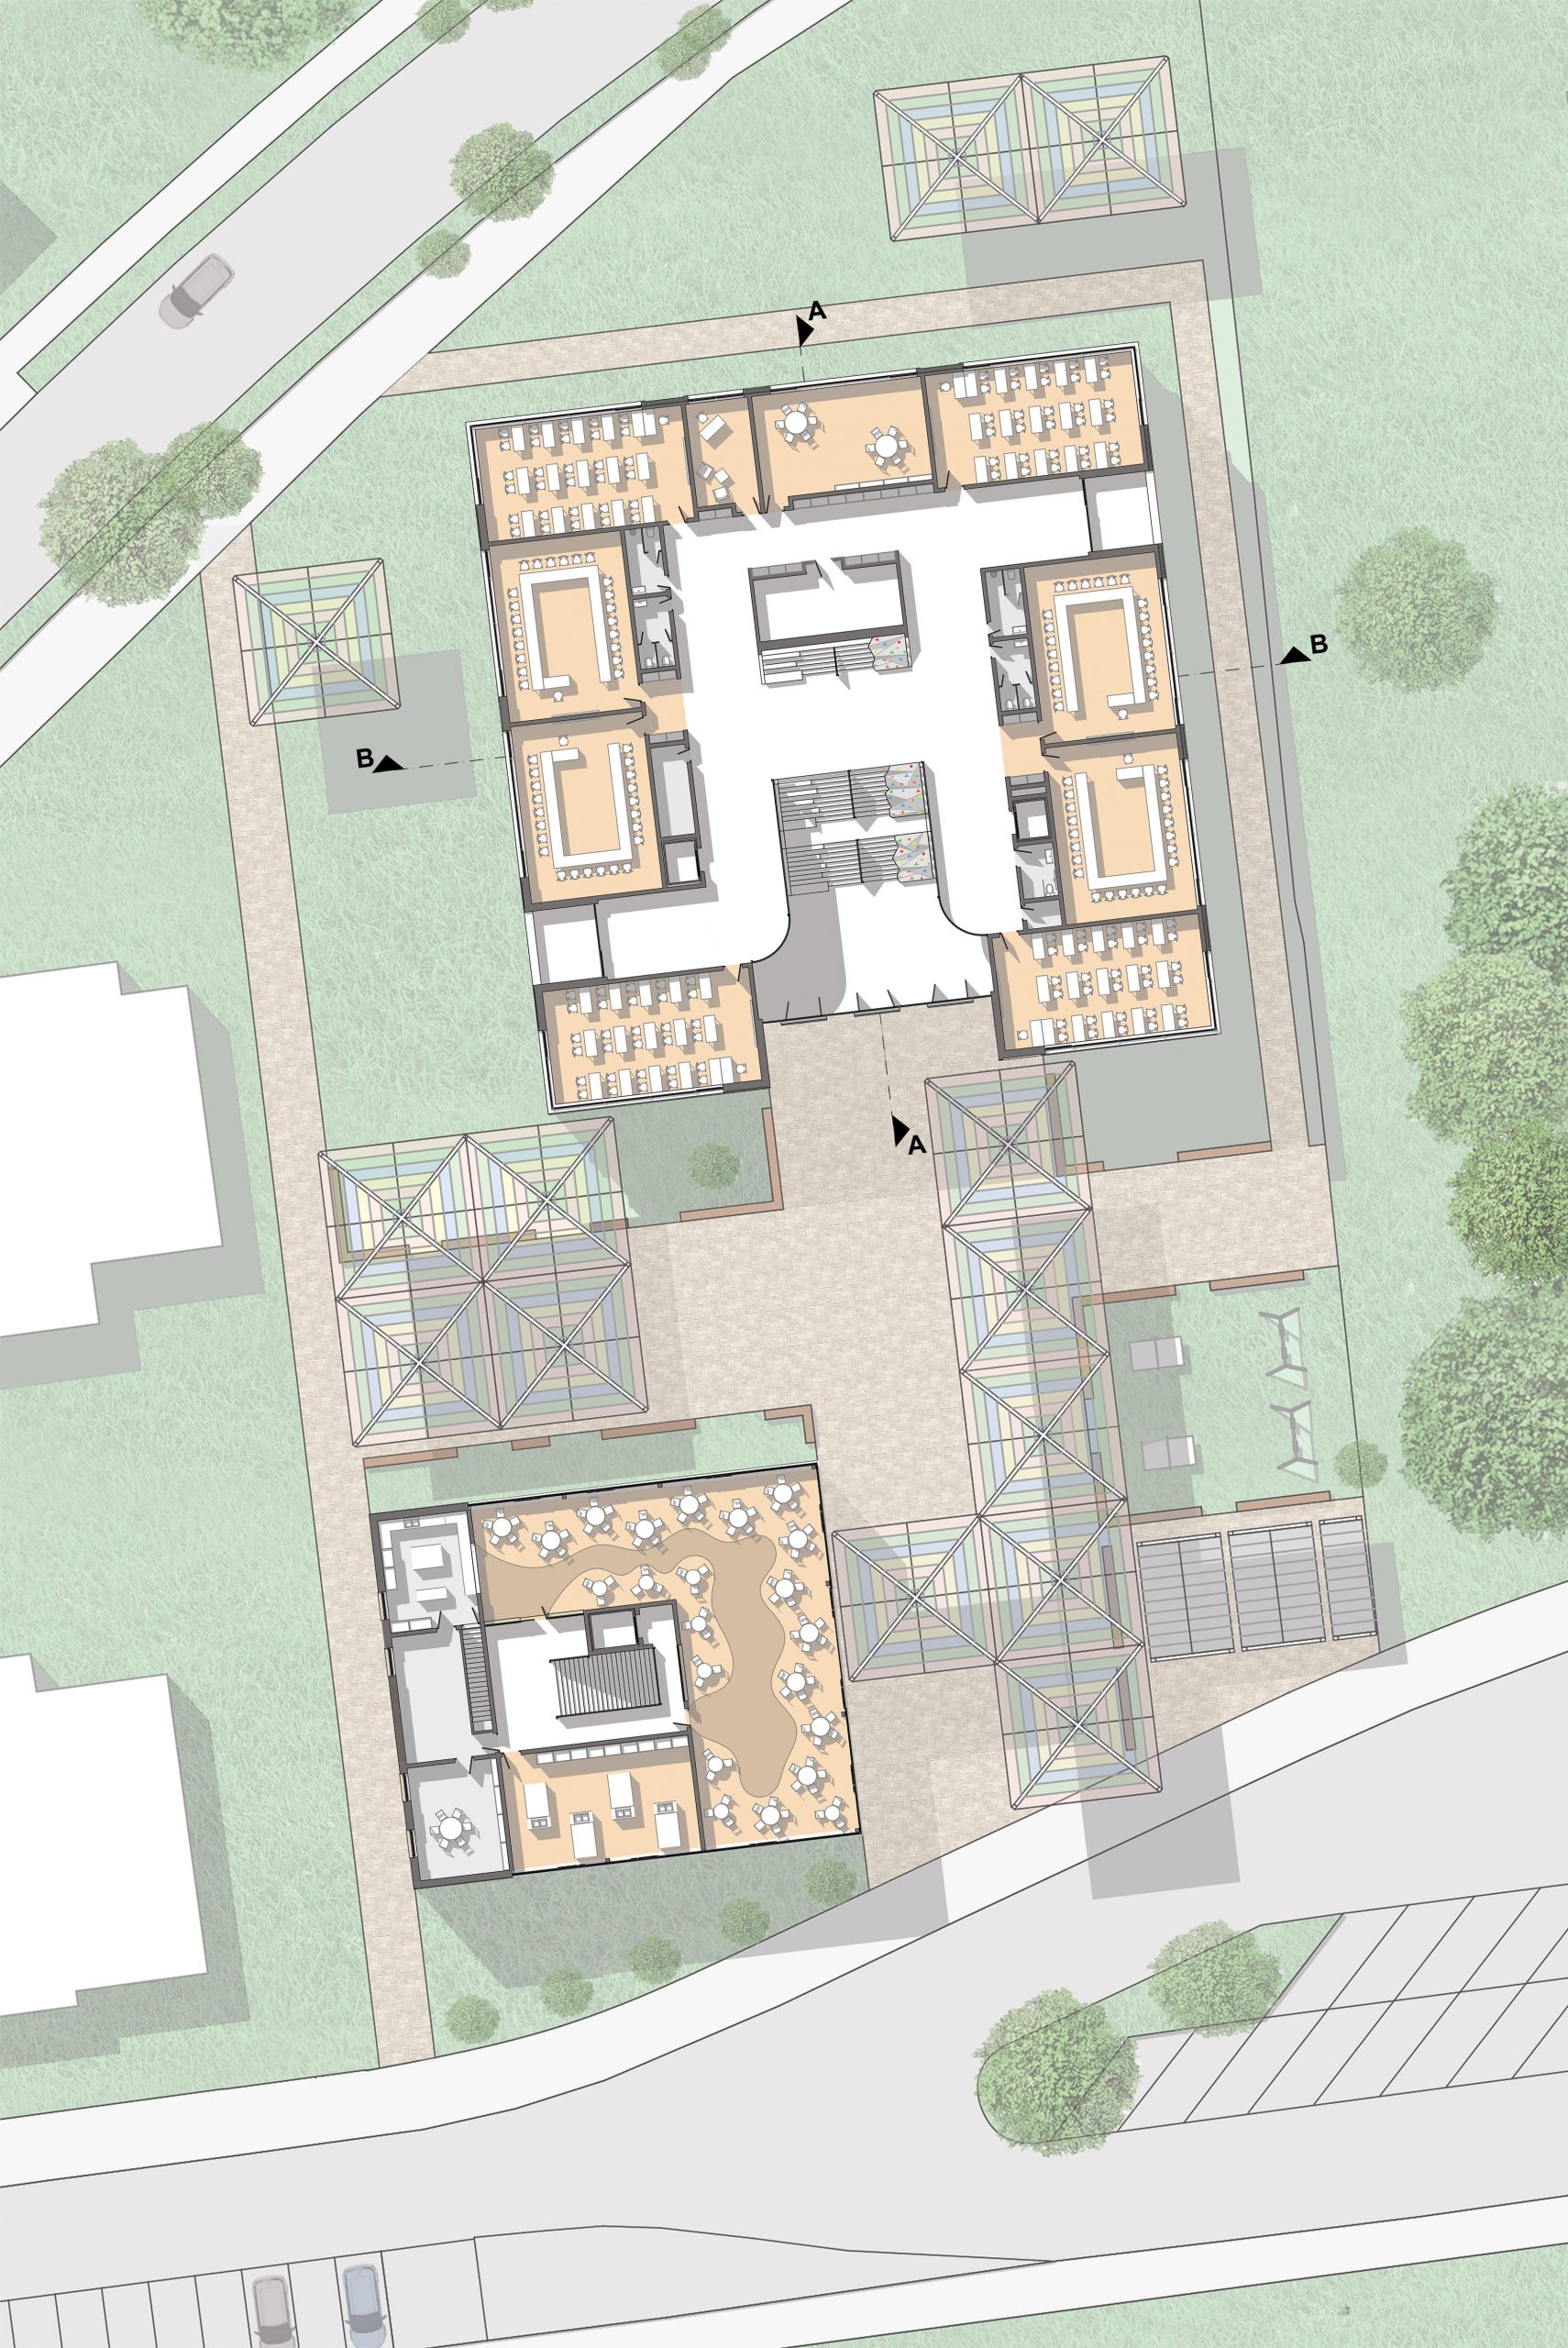
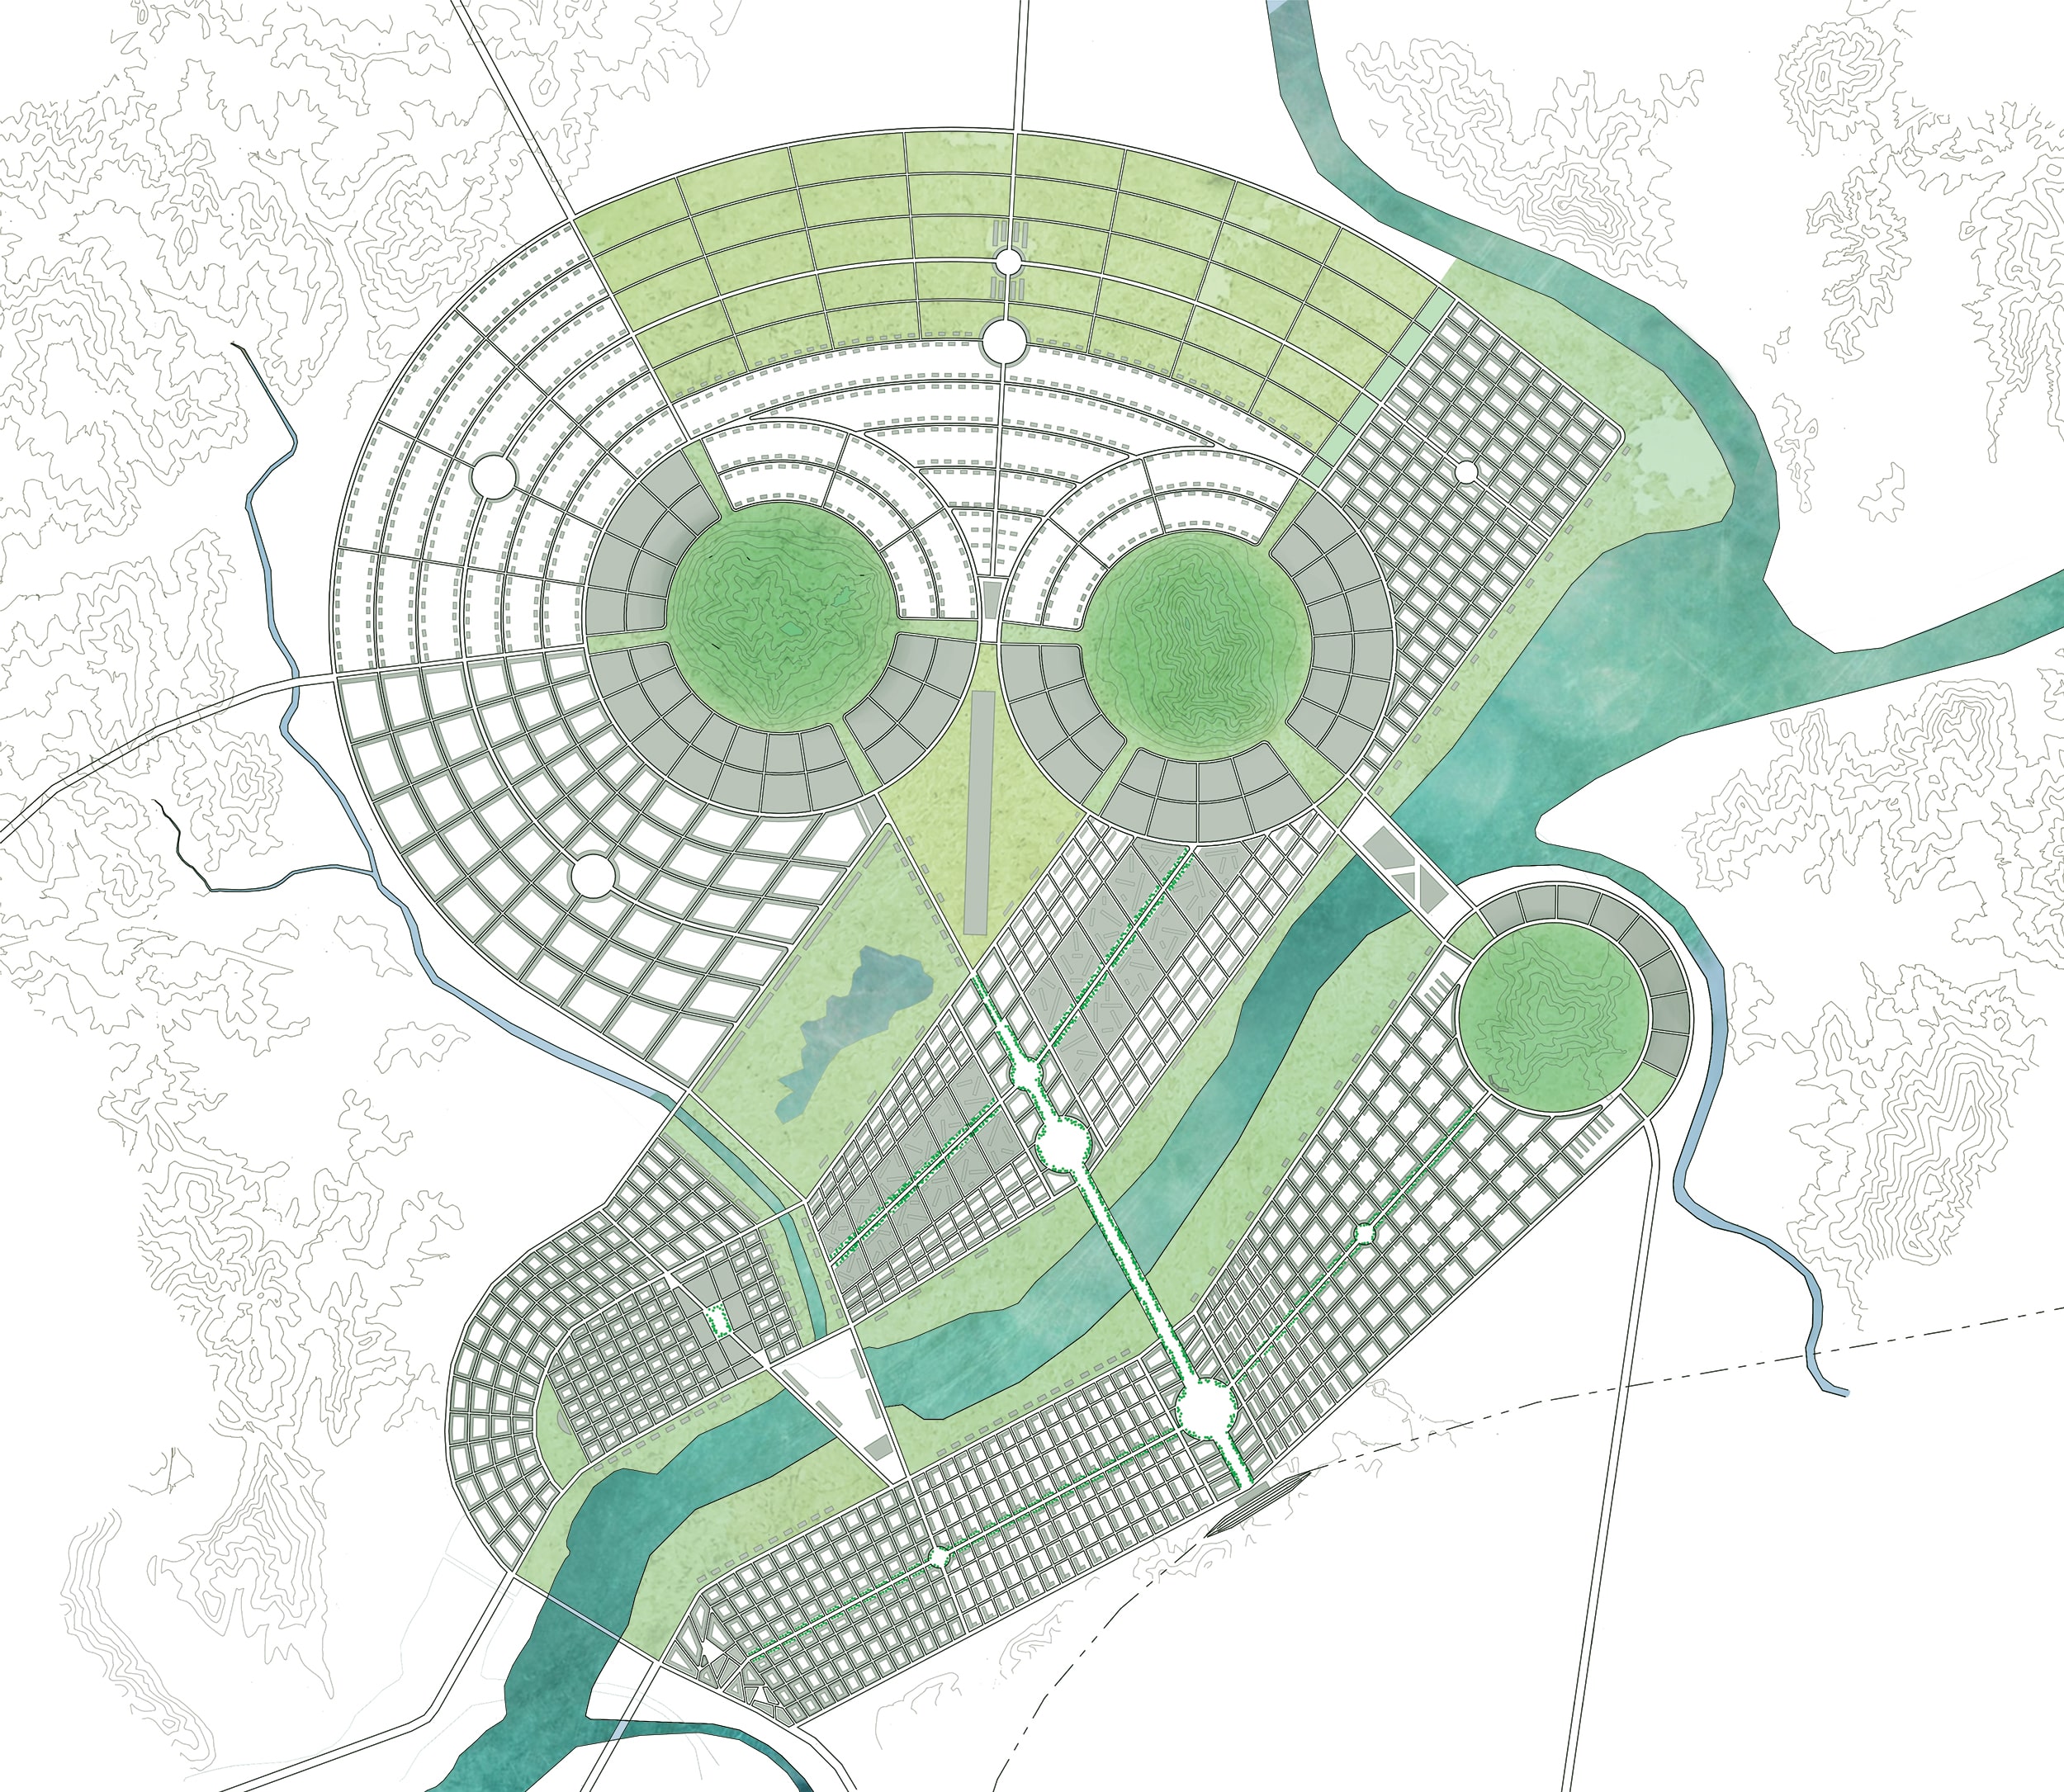
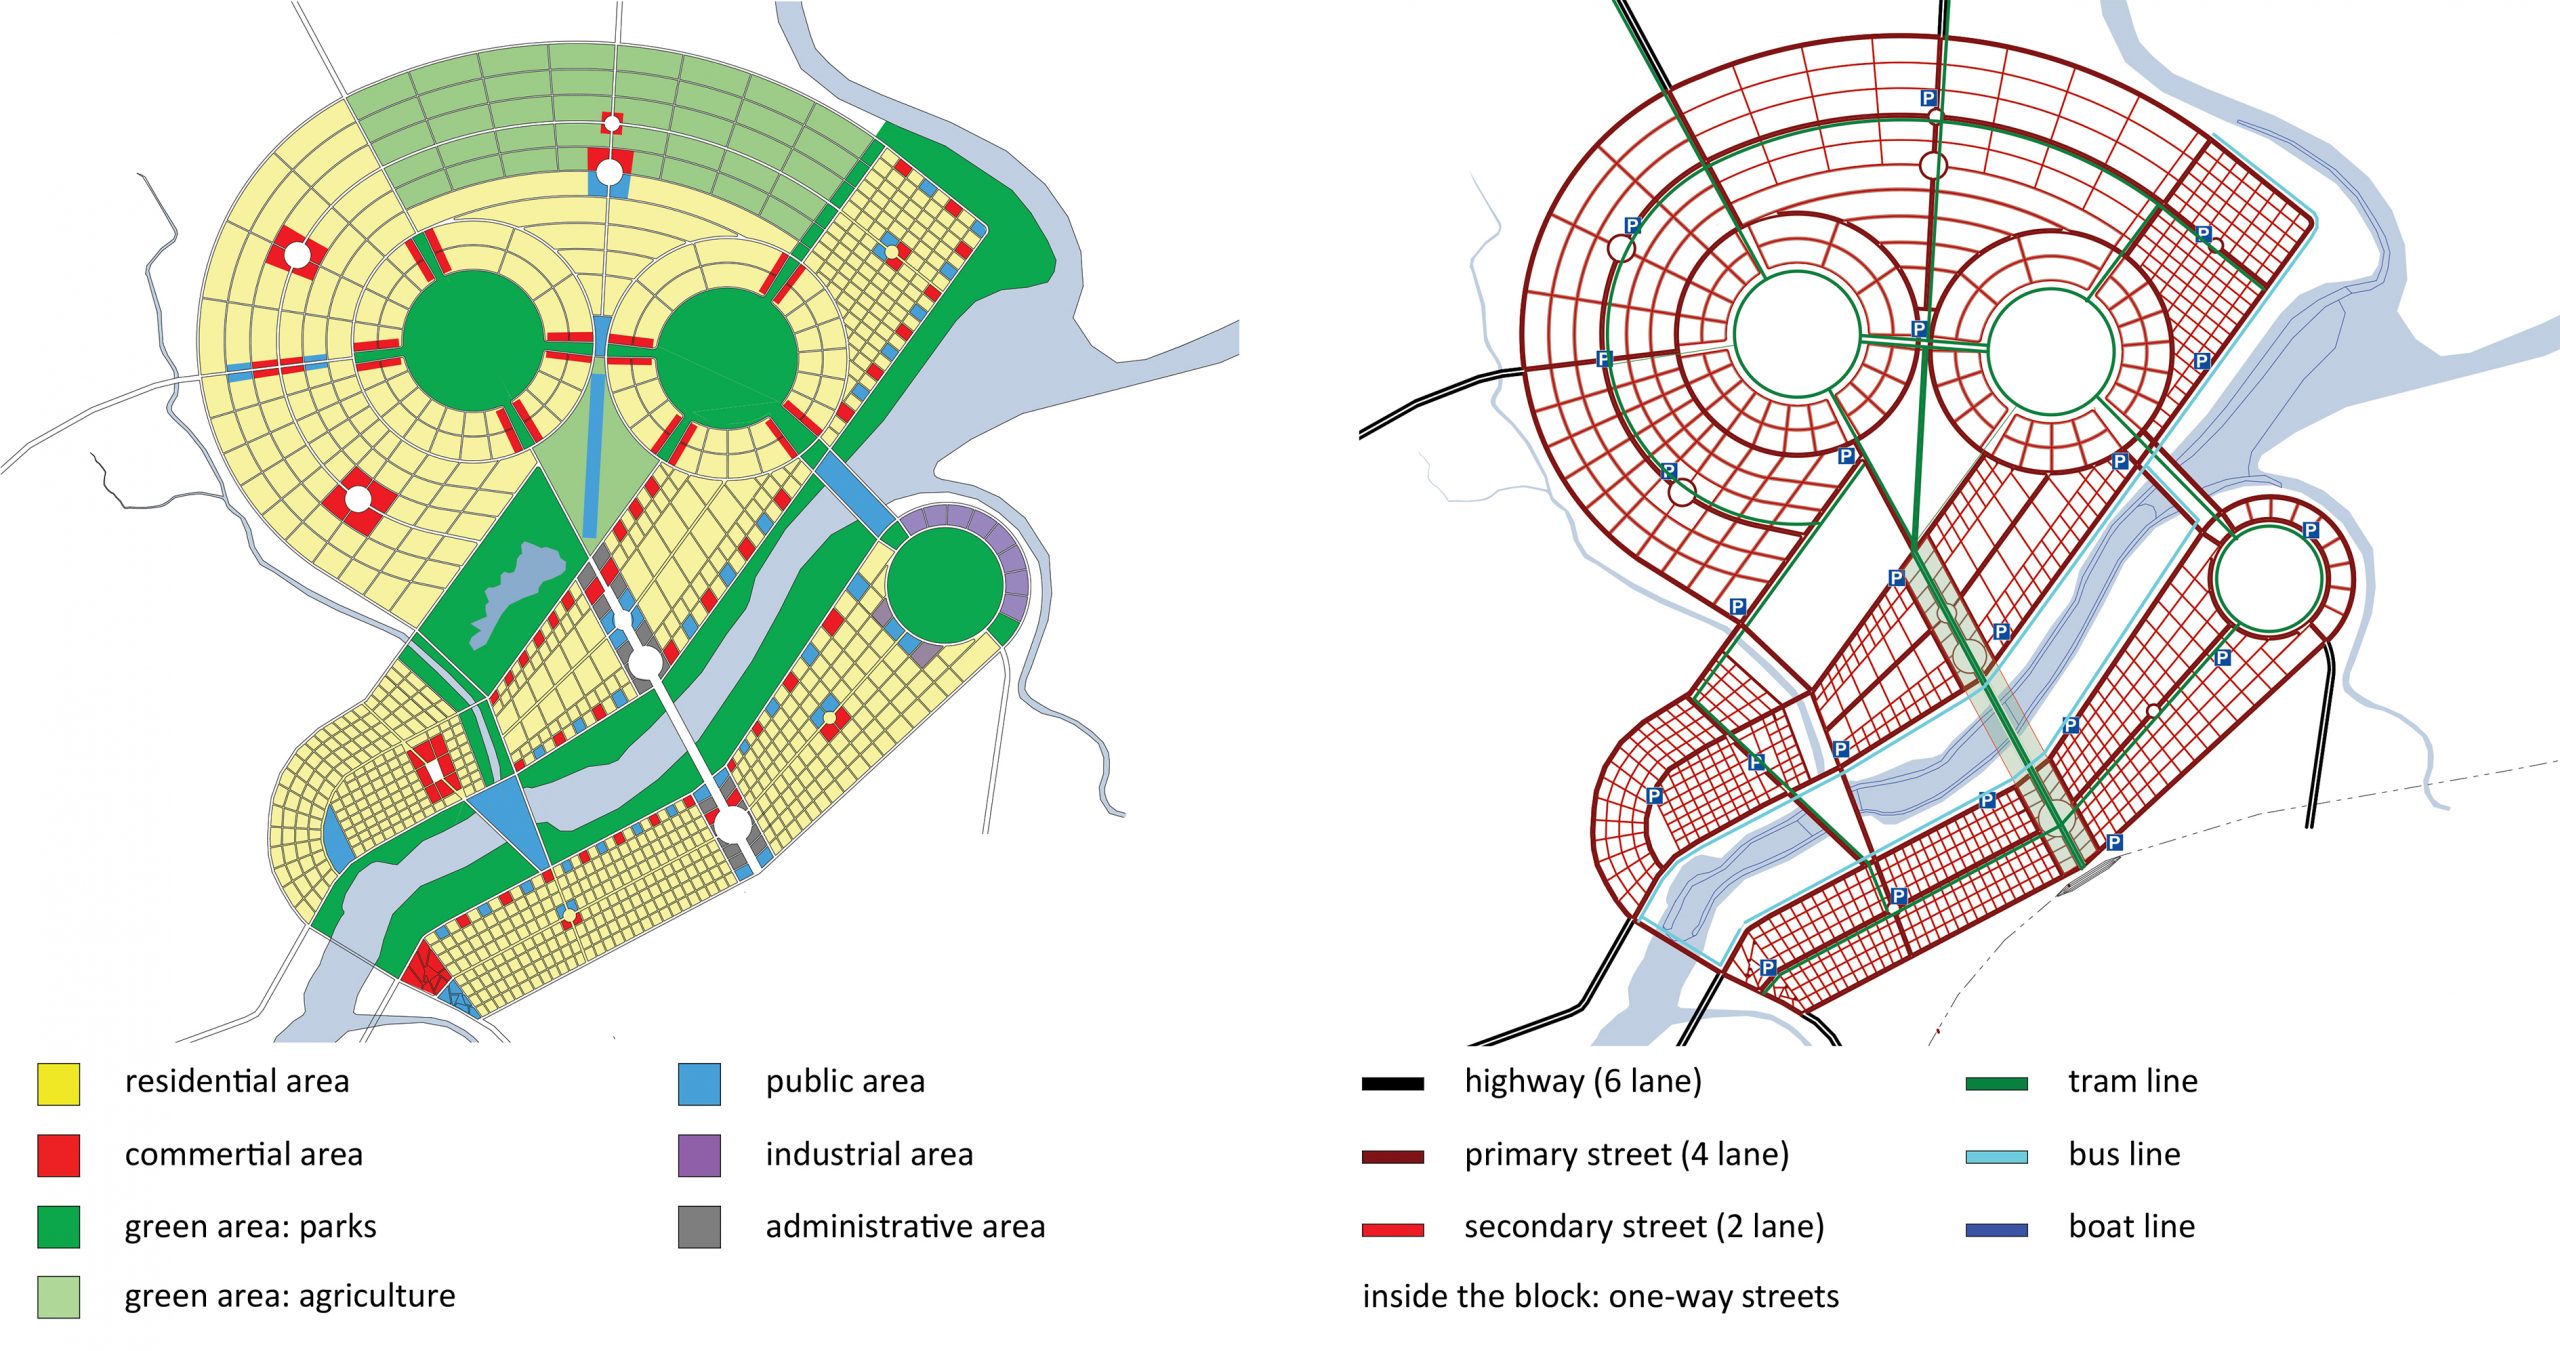
1) simple lines for streets, joined by type. It is easy to download street networks for almost any existing place using QGIS software for querying OSM (Open Street Maps) data. It should already contain information about the road type. Join street geometry, so that every type is on a separate layer and use BlendGIS plugin for Blender to upload them in your project. This is exactly what I did for the site I am working on. If your project contains streets which are in planning, but not yet exist within OSM database, draw them in manually either in QGIS or directly in Blender. Important is only that they are all joined by type and that the lines all lay on the same plane (flat surface). The script will work best with tidy, continuous geometry, where there are no breaks between the line segments.
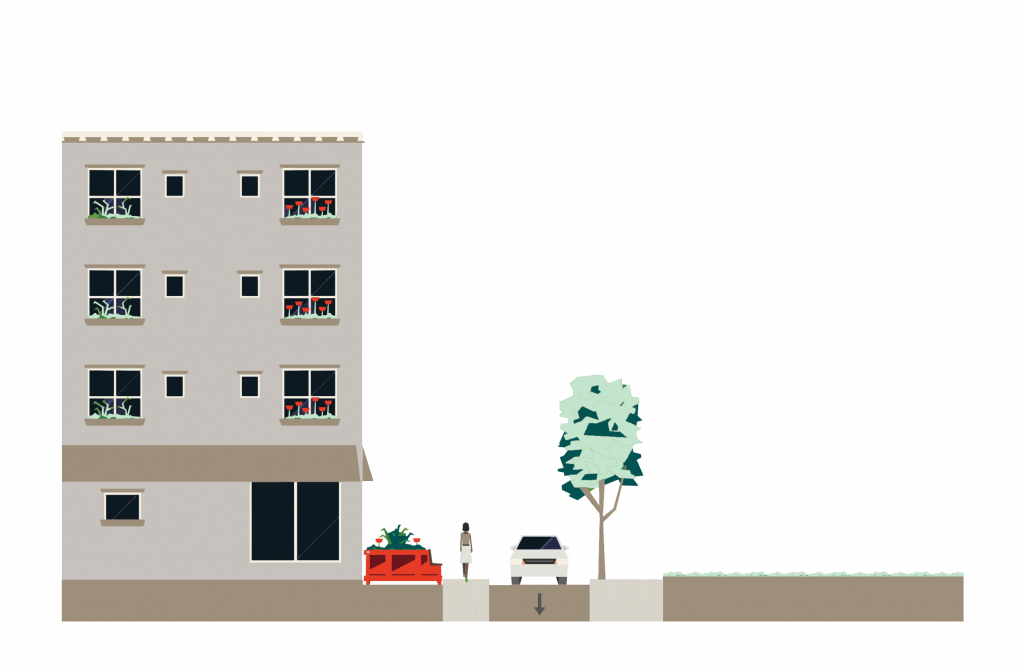
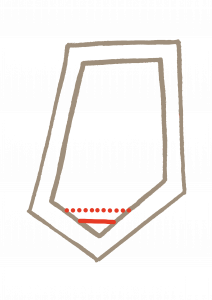
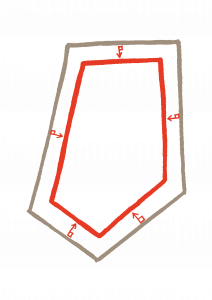
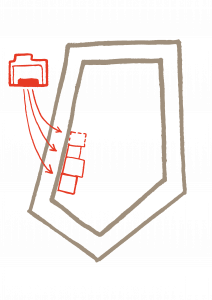
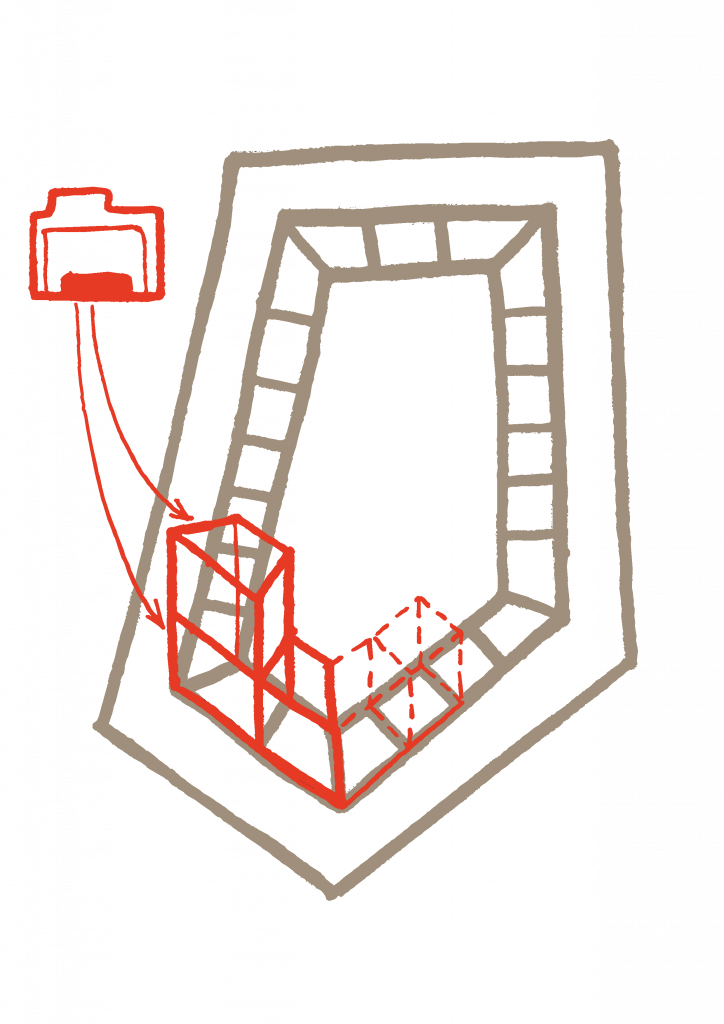
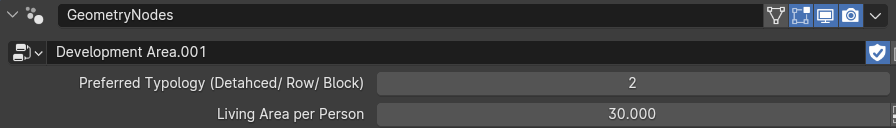
2) polygons for development areas, where buildings should be placed. The facades of generated buildings will align themselves along the perimeter of the polygon. Every polygon should be it´s own, separate geometry. Don´t join them.
3) don´t forget to write down an approximate expected average housing area per person into a corresponding input slot so that the model can calculate how many people the generated housing can provide accommodation for. If you don´t do this, a default value of 30m2 will be automatically chosen. You will still get the results, because this input is not mandatory, but it´s recommended to think about it.
And that´s it! Enjoy the process, as you experiment with different controls while your 3D model changes “on the fly“.
Outputs
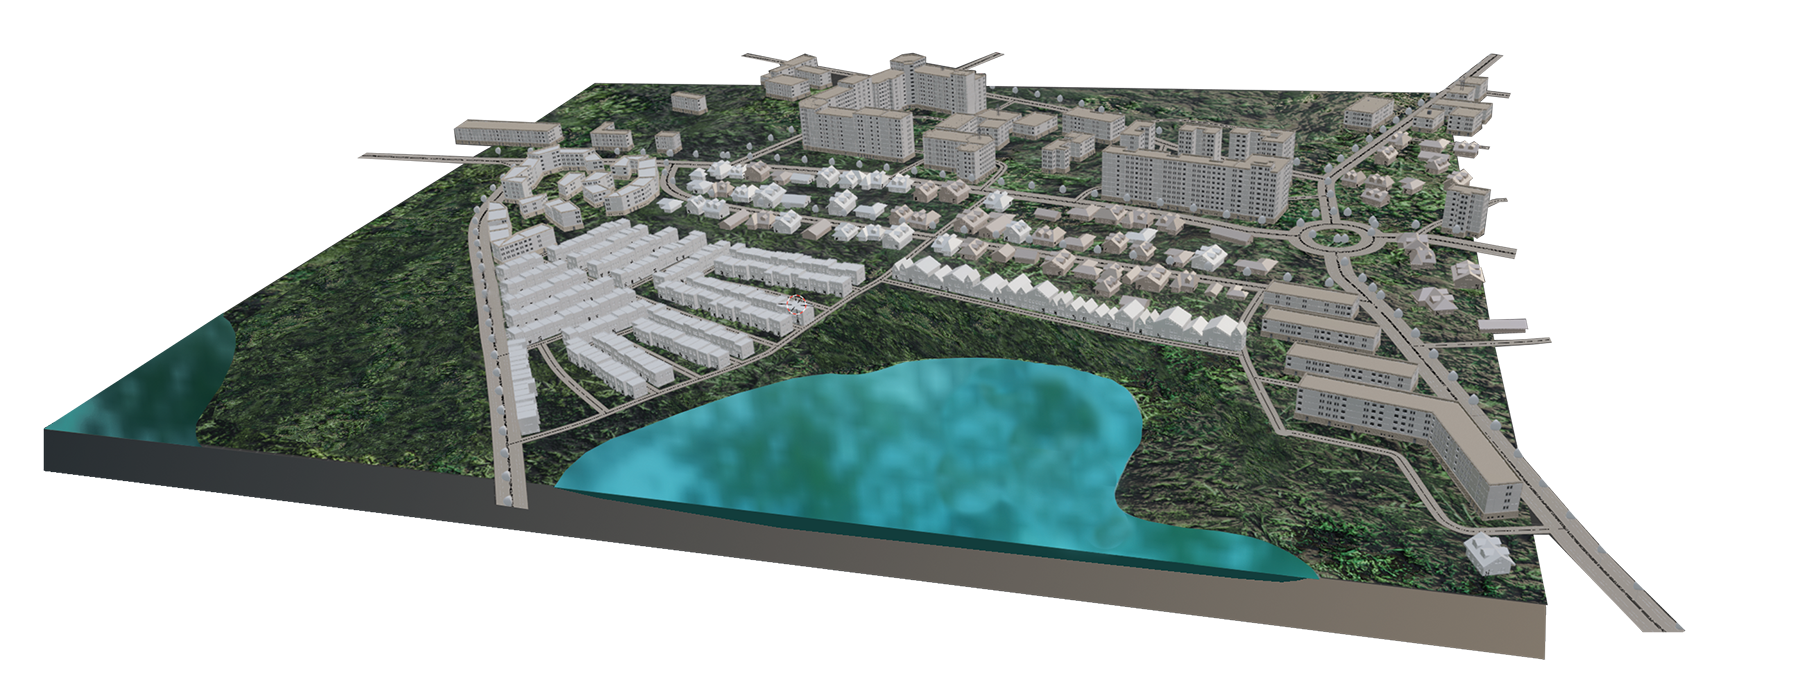
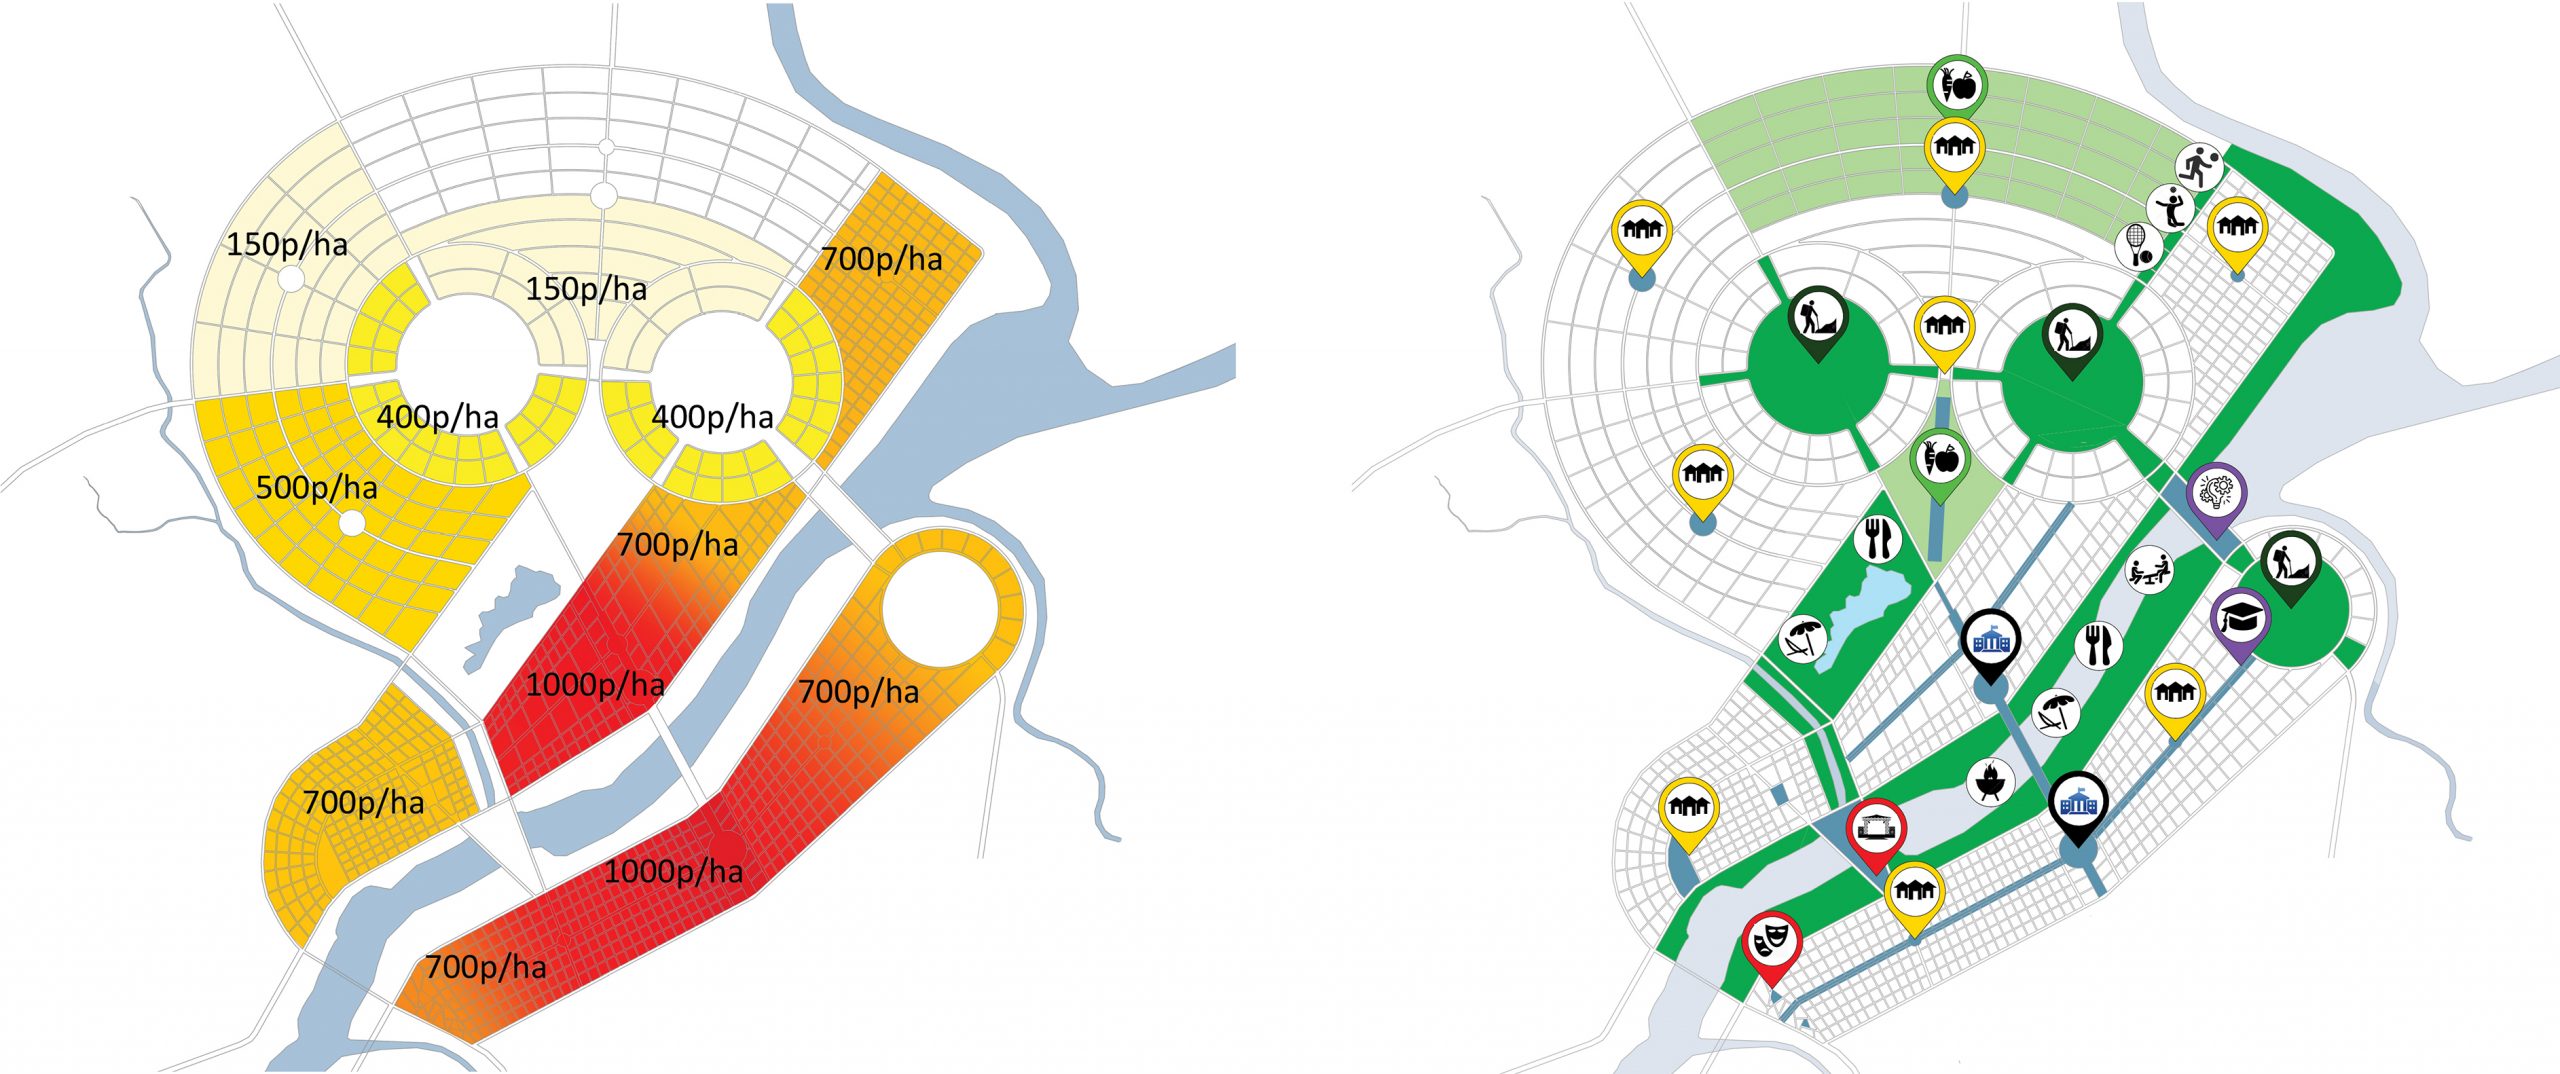
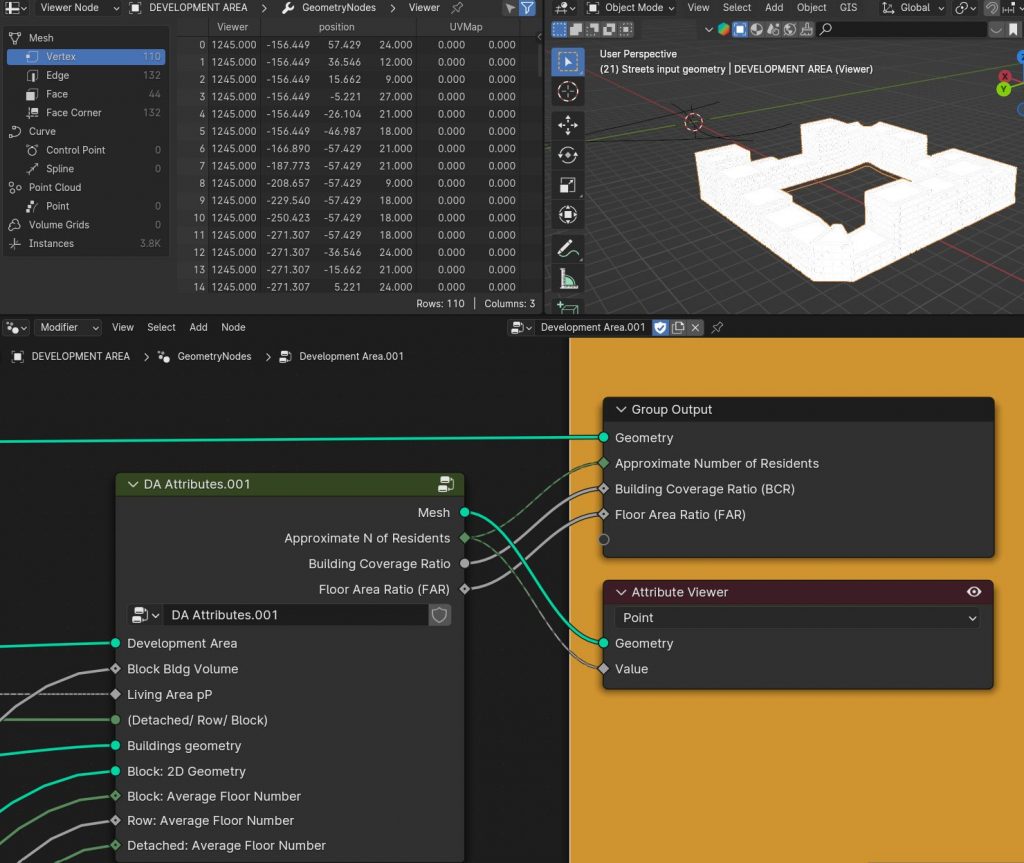
What you should see after providing all the necessary inputs, is a responsive 3D model, adaptable in real time. In addition to geometry output, it calculates and outputs following values, which urbanists often use to compare and evaluate diferent housing solutions:
1) approximate number of people for each development area;
2) building coverage ratio (BCR) for each area;
3) floor area ratio (FAR) for each area.
Generative process
In this abstract I will explain the logic behind the algorithm of BSG that creates geometry throughout the whole journey from input to output.
Street generation
The street is the city’s most important element. (Pallson, 2020) Kevin Lynch also noted that paths were predominant elements in people´s image of space with other elements being arranged along them. (Reicher, 2016, pp 212-213)
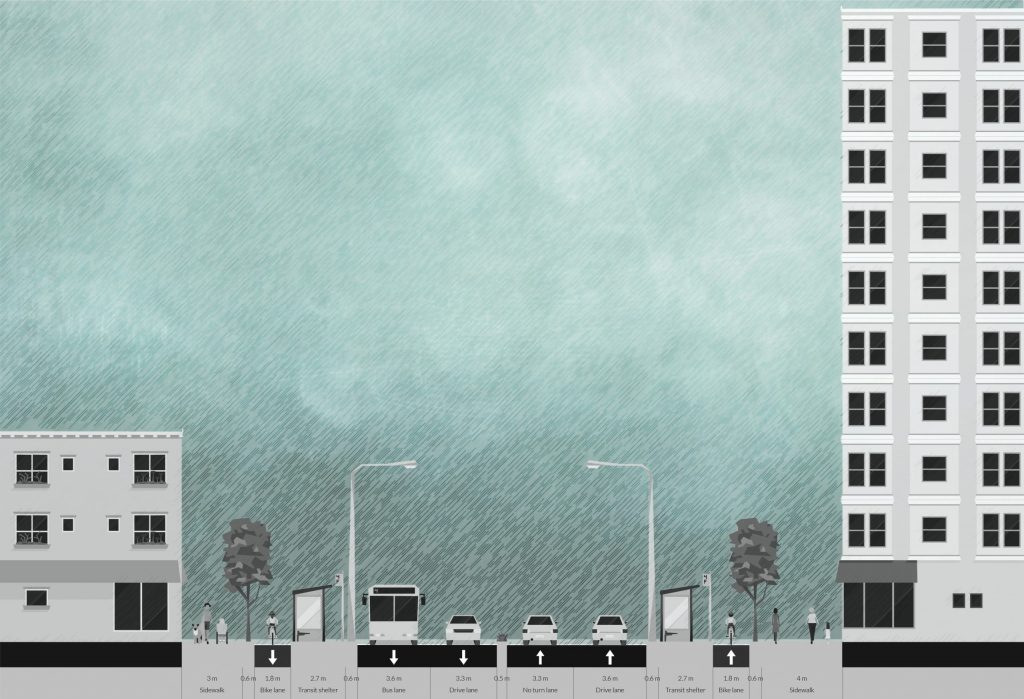
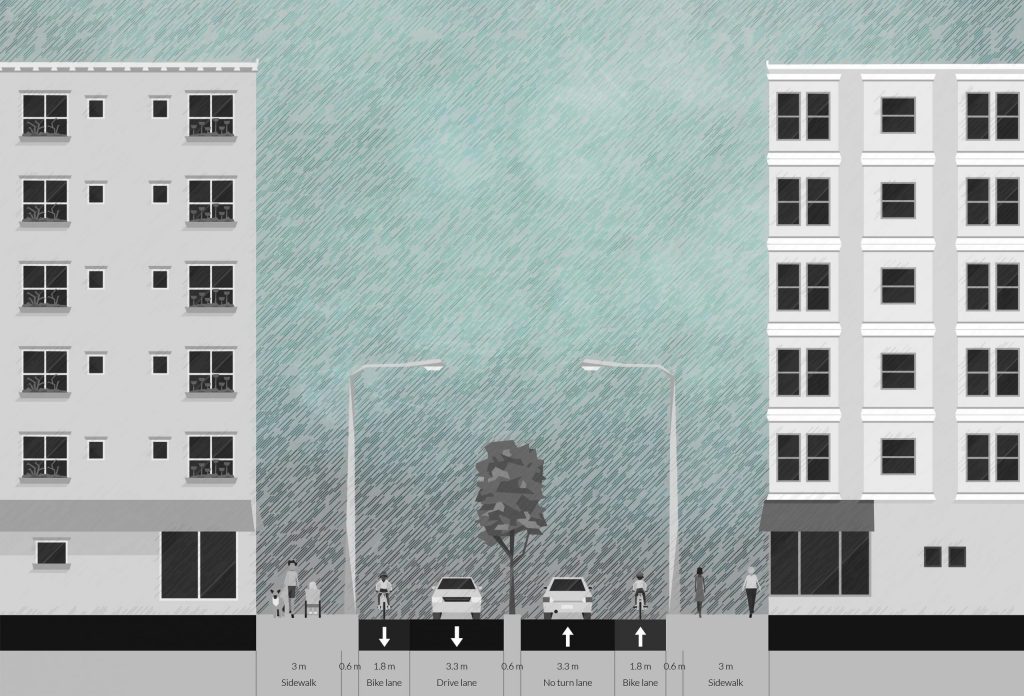
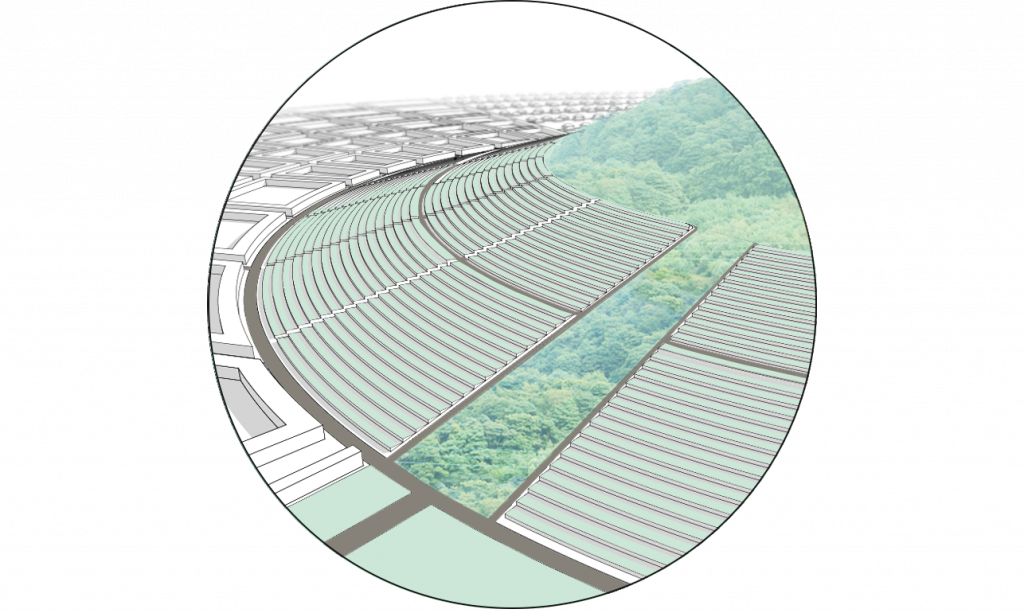
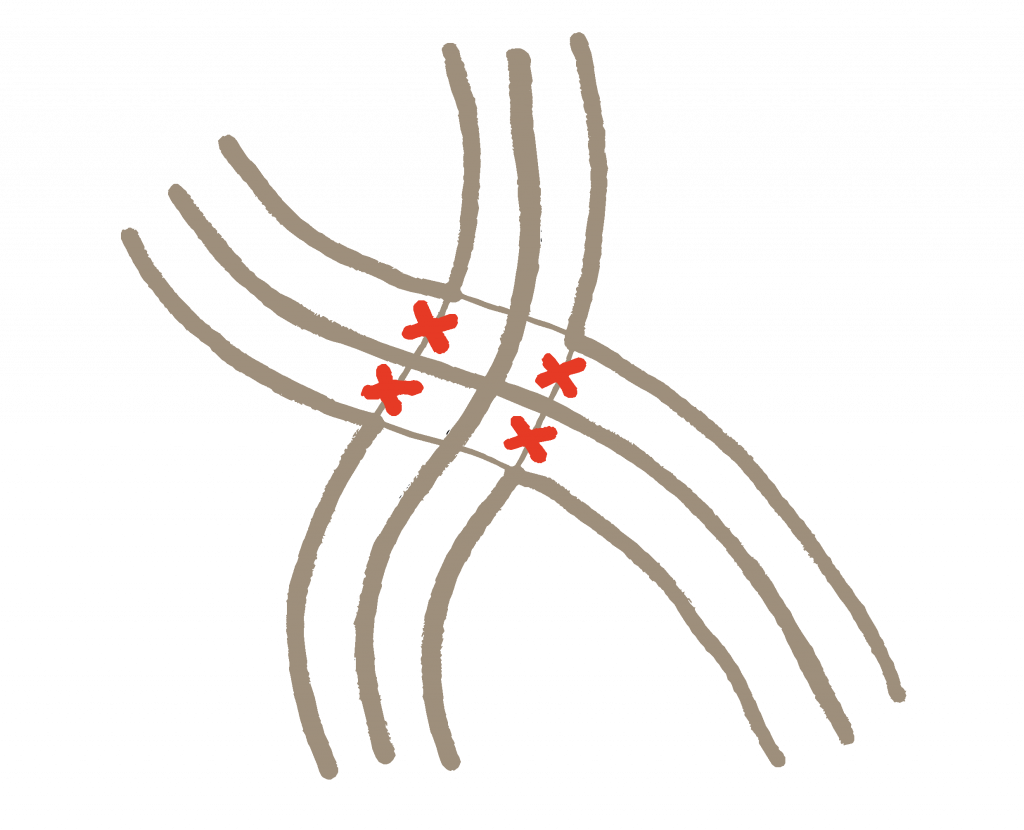
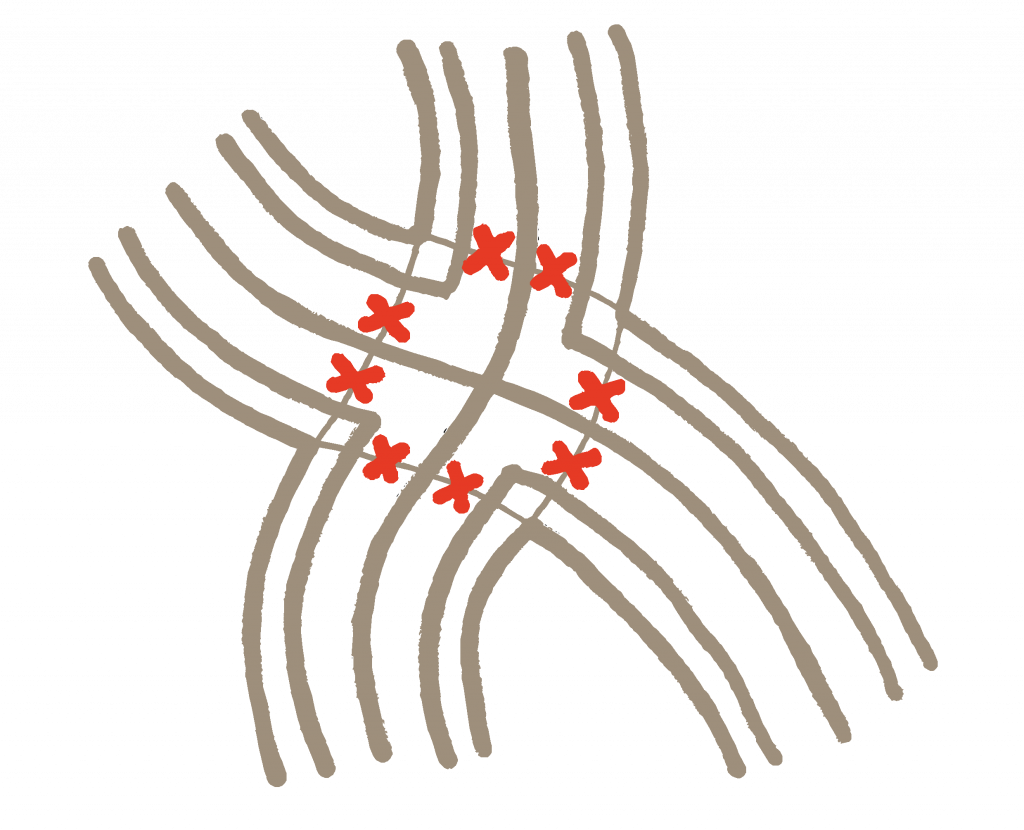
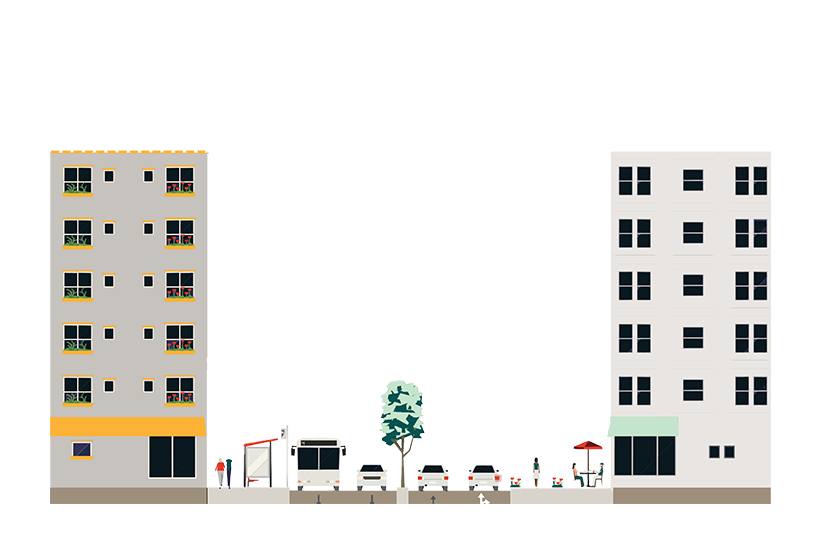
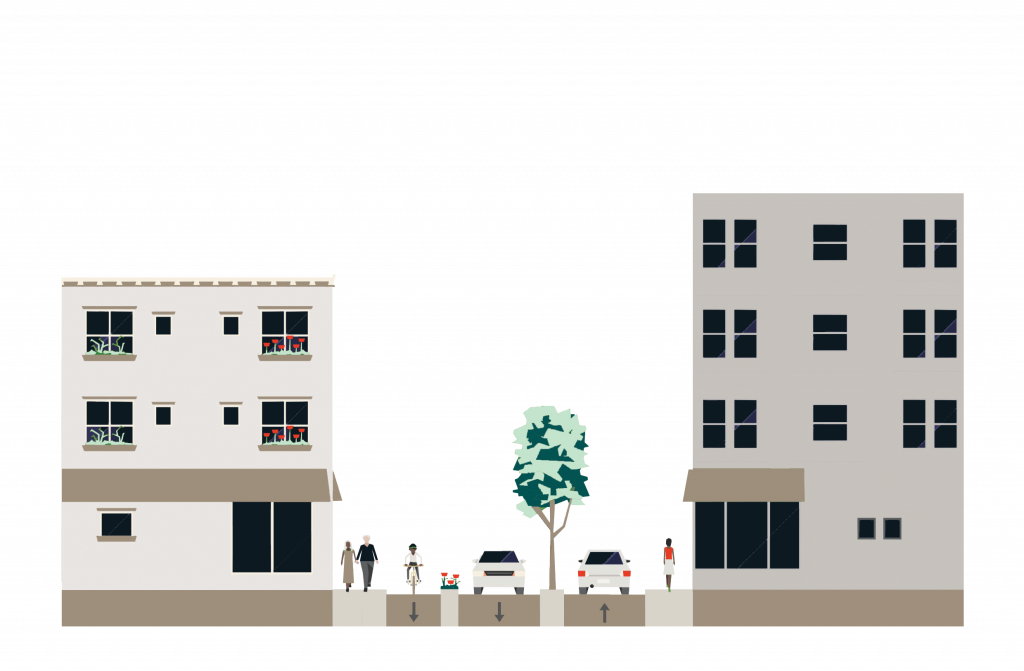
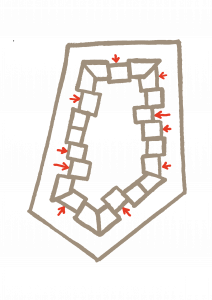
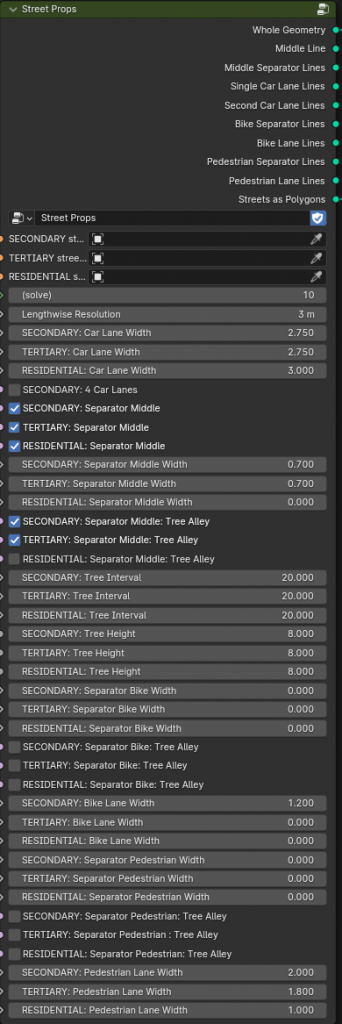
The process of creating street geometry out of a line is very simple. The algorithm is set to extrude those lines symmetrically into both directions perpendicularly to the spline tangents on the XY plane (flat ground). Users can control the length of the extrusion vectors, which is equal to the road width. If you uploaded different road types as separate layers, you can control the width of each of them separately. Usually, roads of the higher hierarchy are also wider. After the extrusion, the overlapping geometry at the intersections is being deleted.
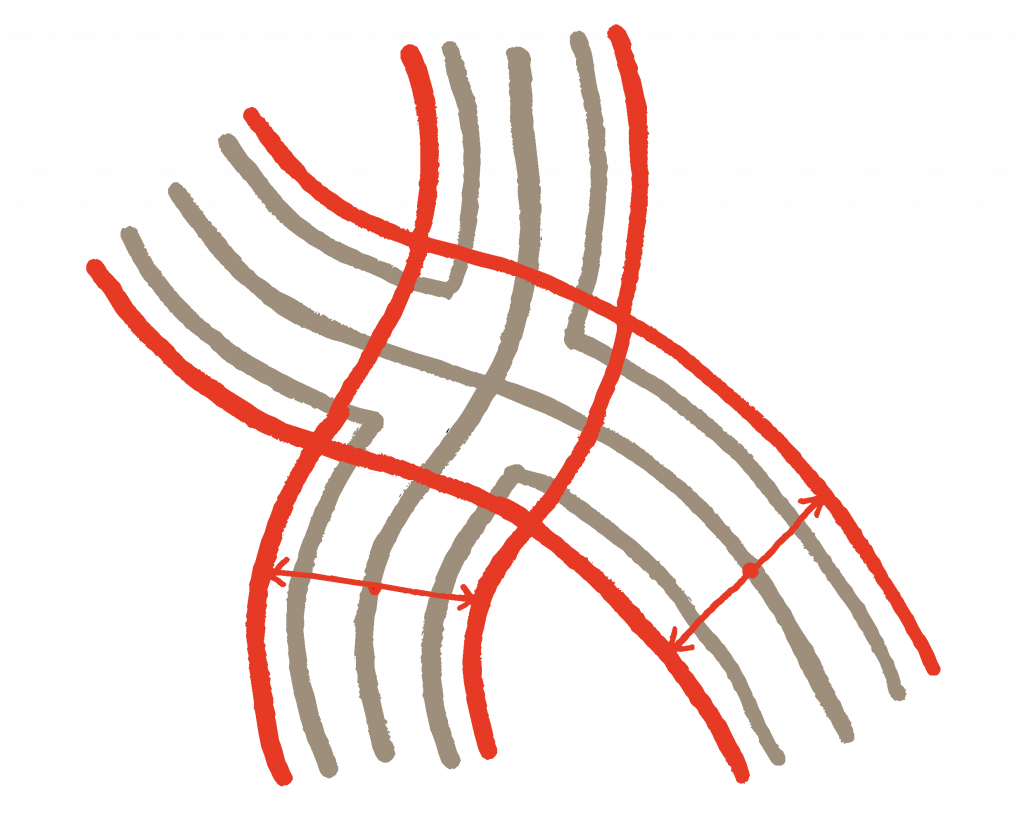
Same principle is being repeated for each additional street element (be it bike lanes or sidewalks). The width of every element is being added to the ones, that are closer to the initial line. Thus, the overall width of the street increases.
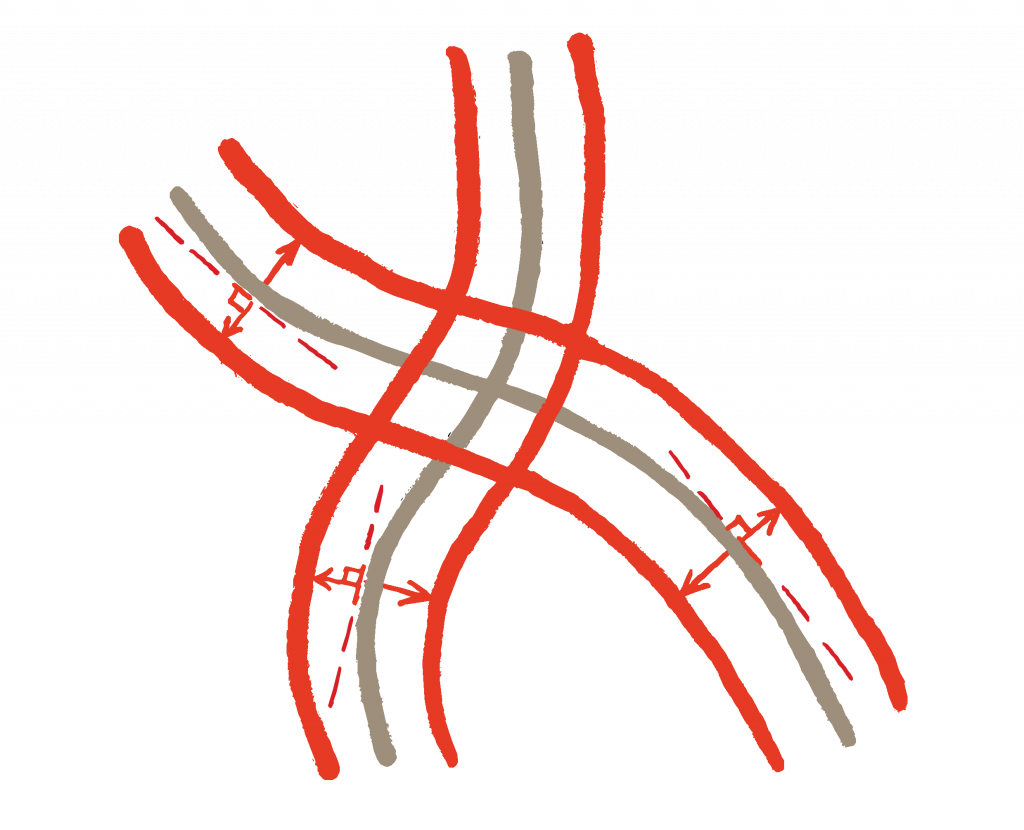
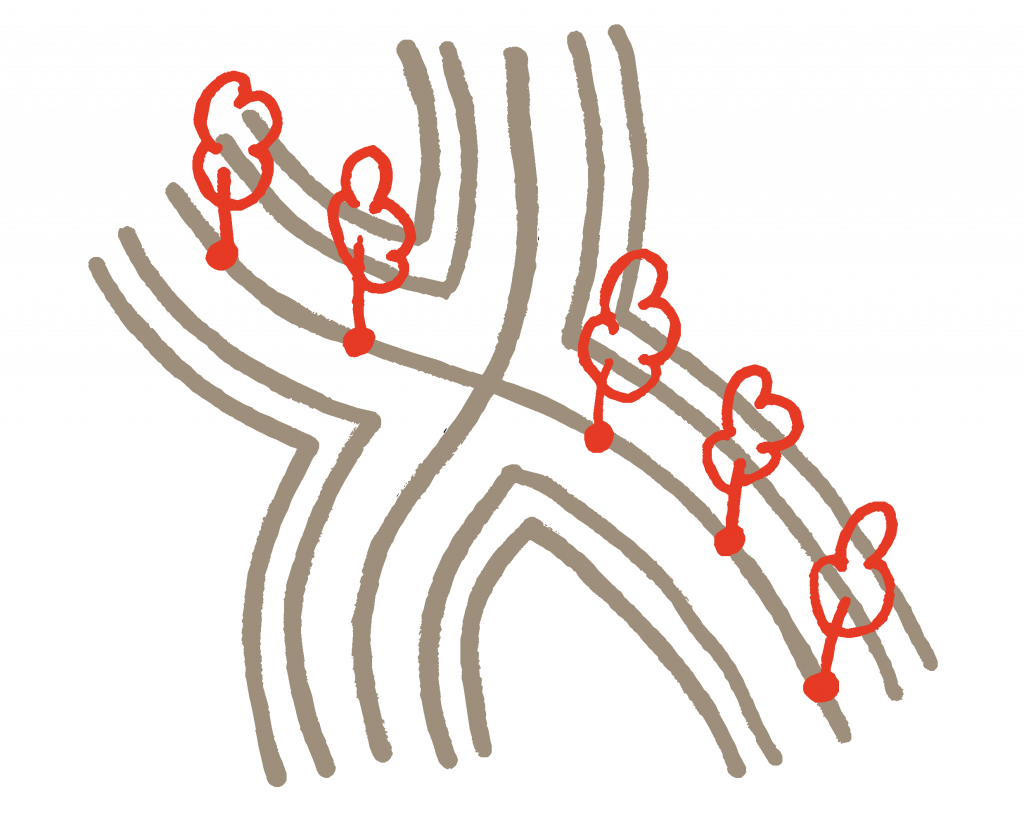
One can add more elements either by checking corresponding boxes in the node input or by setting the width of the element from 0 to a desired value. By checking boxes, the user is reseting boolean values and depending on this, different geometry is being parsed. Boolean geometry nodes always have two input sockets and one output socket. For example, by checking a box “Tree Alley”, instead of an empty geometry, a geometry is being called now, where the curve is resampled by length (equal to Tree Interval) and tree models are distributed on corresponding curve´s vertices.
Available street elements are listed in the table 1.0 (below). Separators are safety barriers between different road elements. In reality, they often come in a form of pillars, concrete bars, stripes of lawn or tree alleys.
Also in my model it is possible to put tree alleys at the separators. I differentiate between the middle separator (between car lanes) and the side separator (either between a car lane and a bike lane or between a bike lane and a sidewalk).
Configuration of the street is an important task in urban design, as it is able to influence the atmosphere of open space along this street. Just try to play with controls and see for yourself!
Secondary Streets:
Roads which are on top of the hierarchy (like primary and secondary, sometimes tertiary, dependent on country´s classification), often have more than just two car lanes. There is a possibility to add two more lanes to secondary roads.
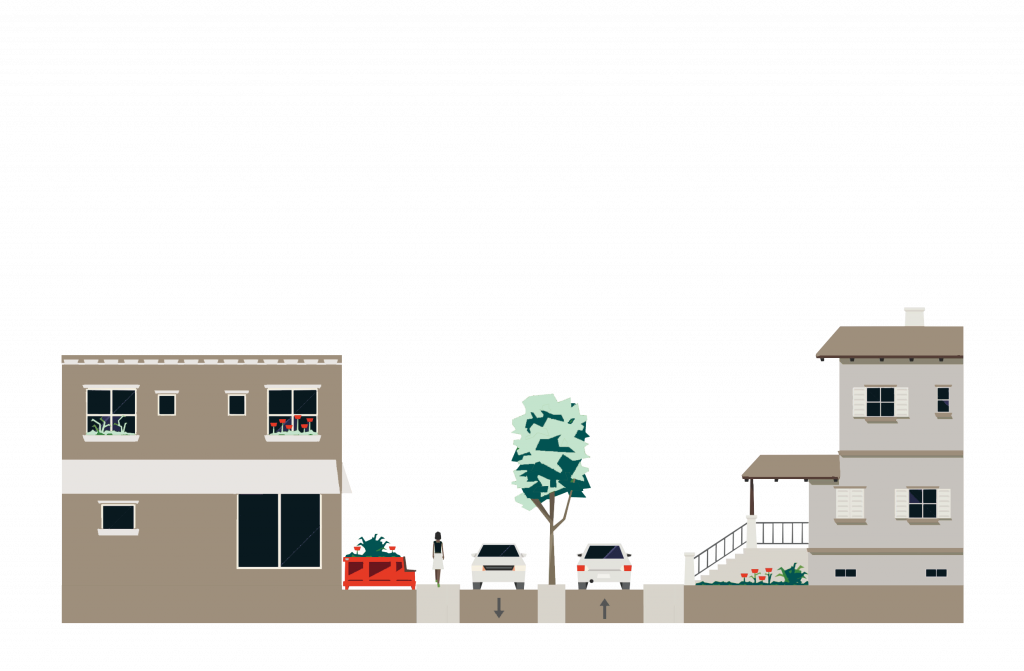
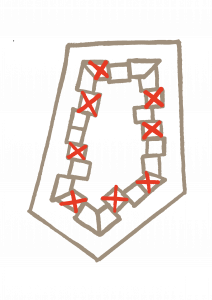
Tertiary Streets:
Here are shown some of, but not all possible configurations of tertiary streets.
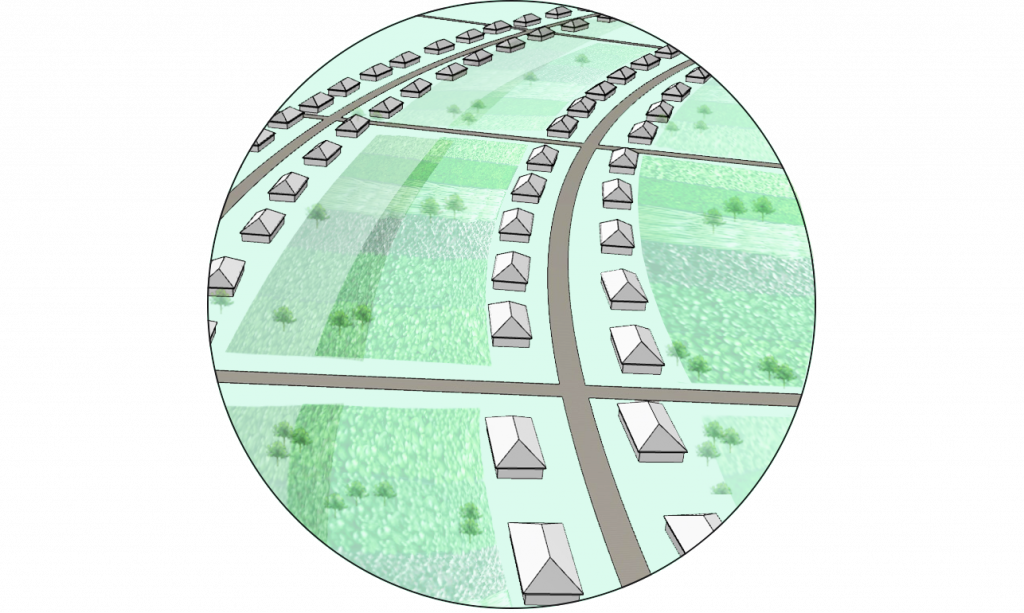
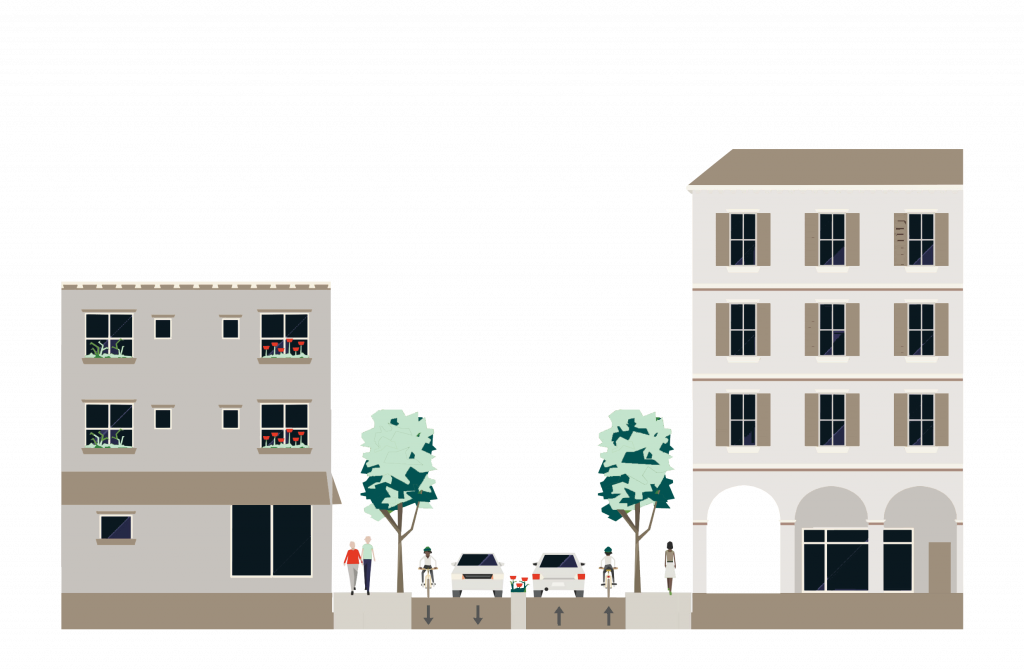
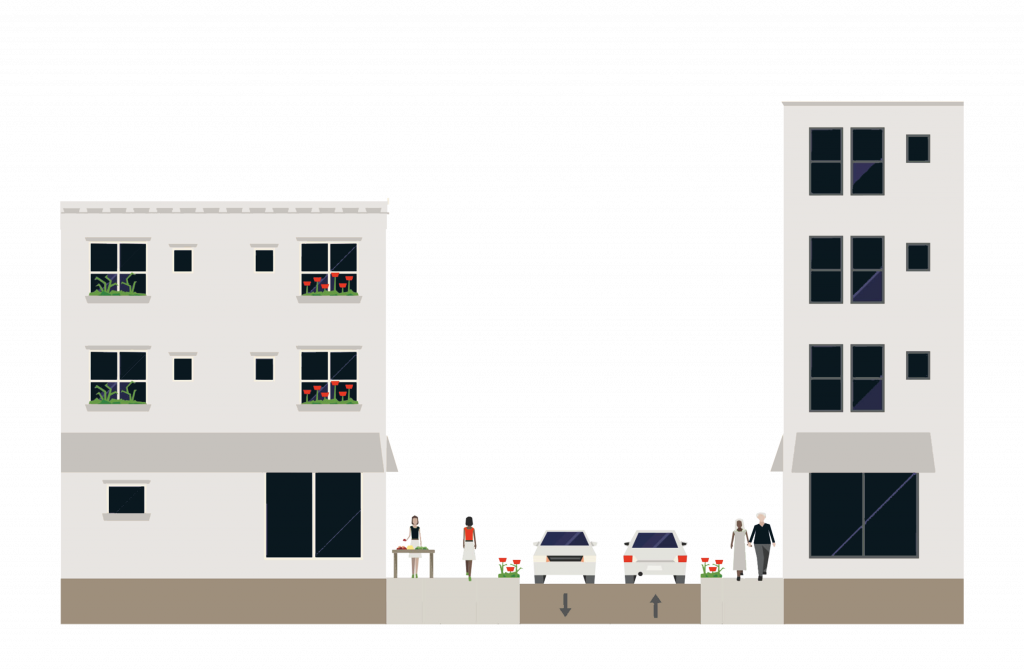
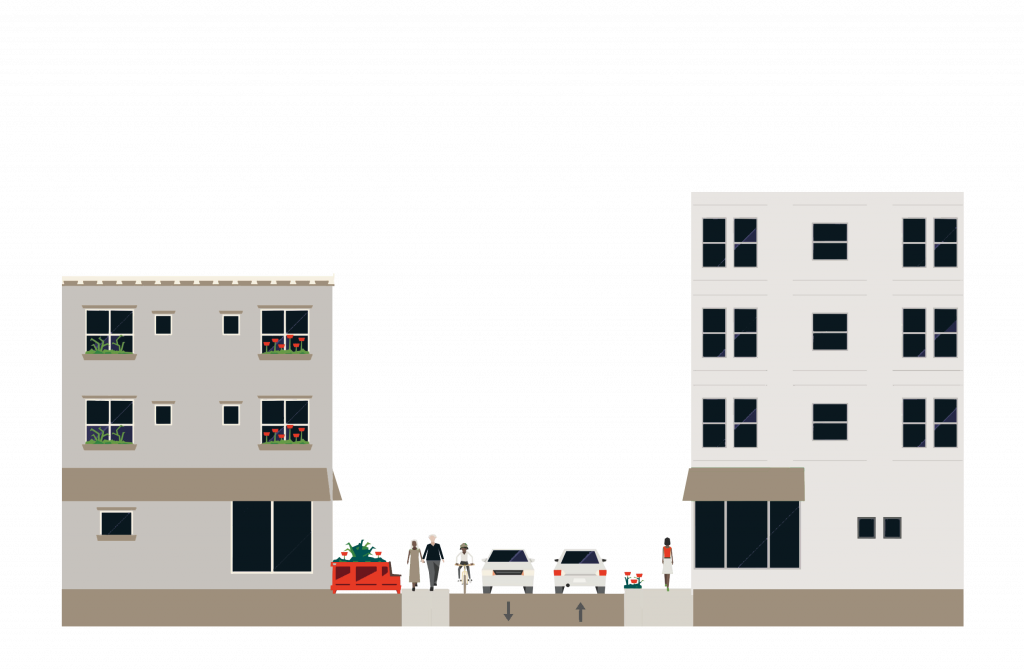
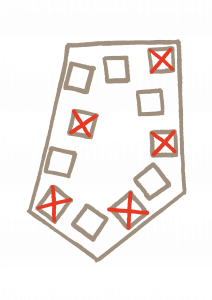
Residential Streets:
Here are some examples of how residential streets
could look like.
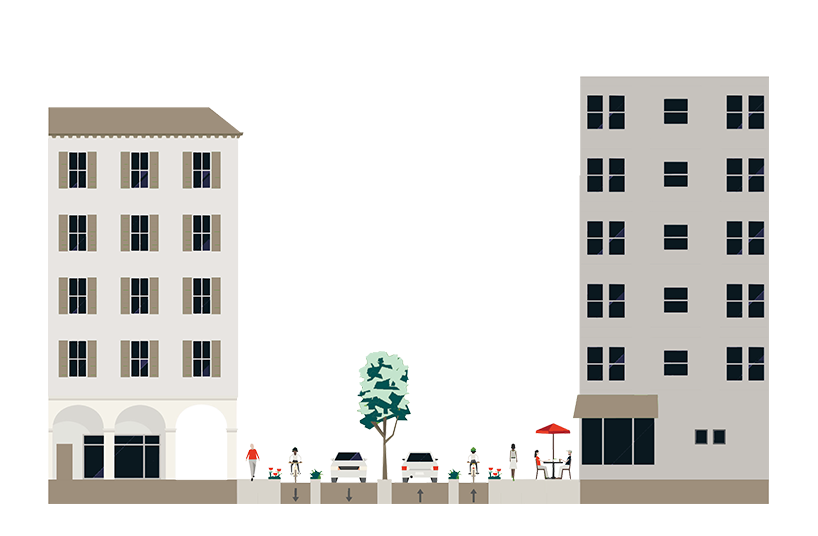
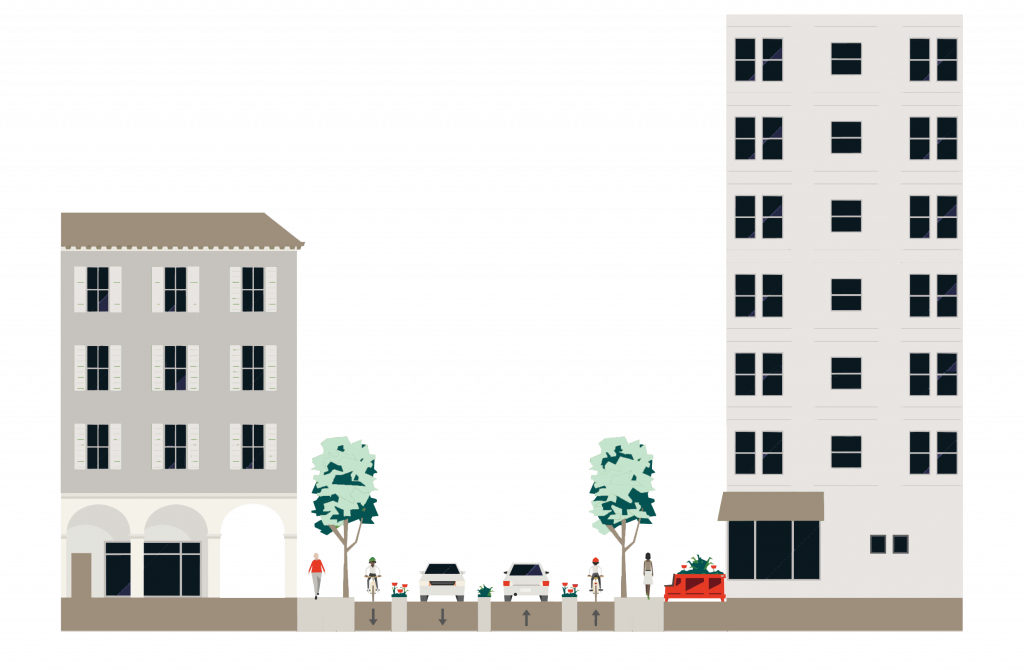
Moreover, roads which are on top of the hierarchy (like primary and secondary, sometimes tertiary, dependent on country´s classification), often have more than just two car lanes. There is a possibility to add two more lanes to secondary roads.
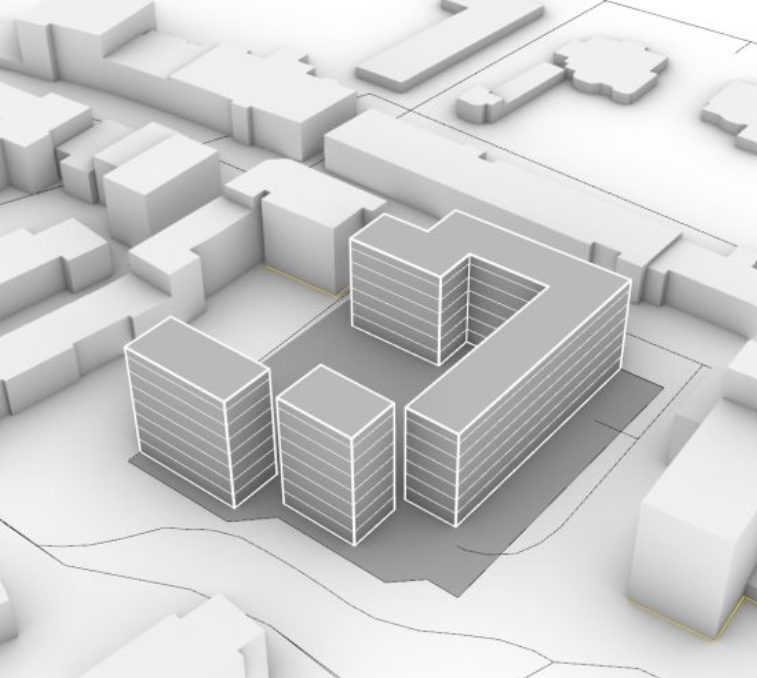
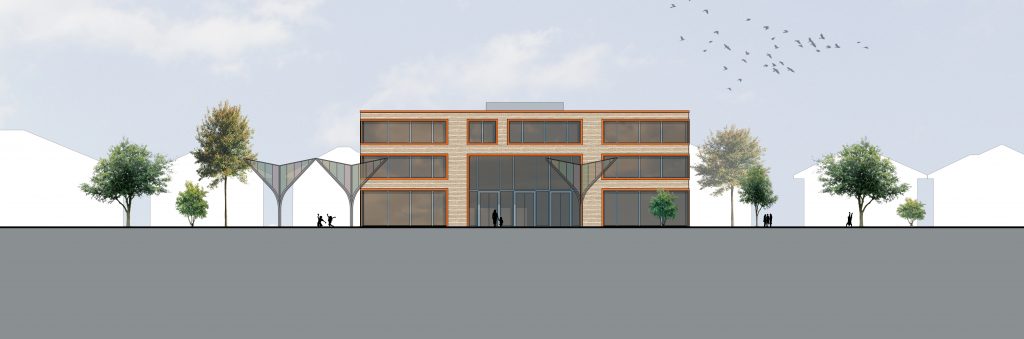
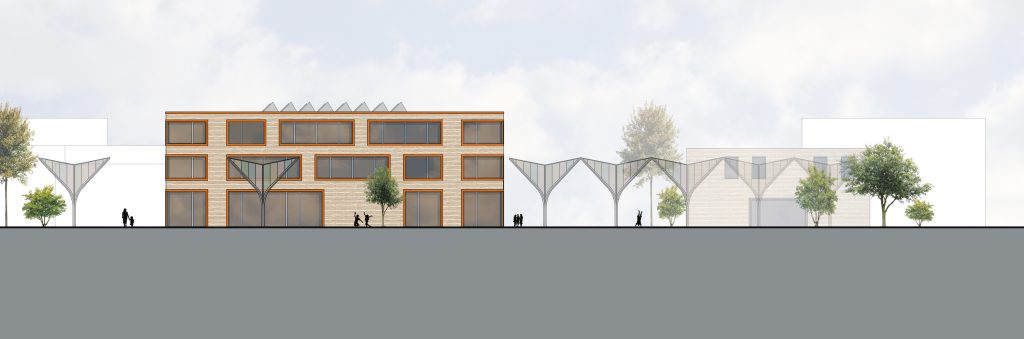
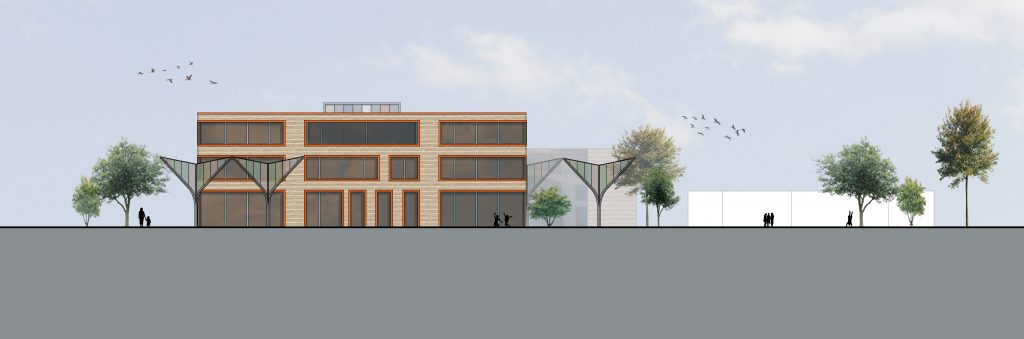
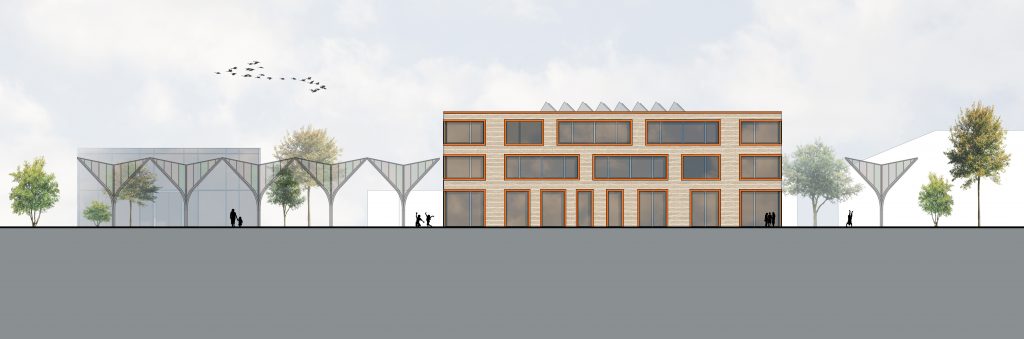
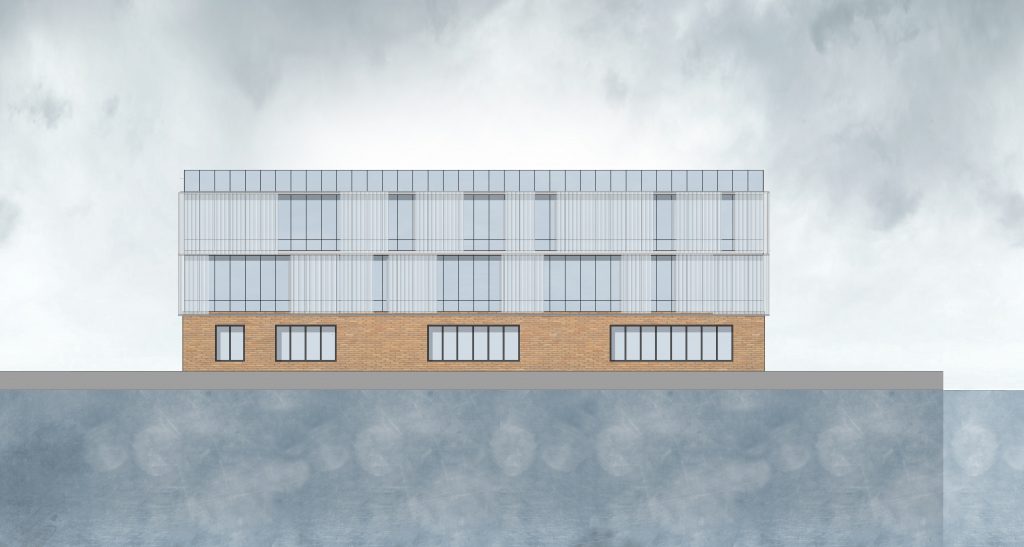
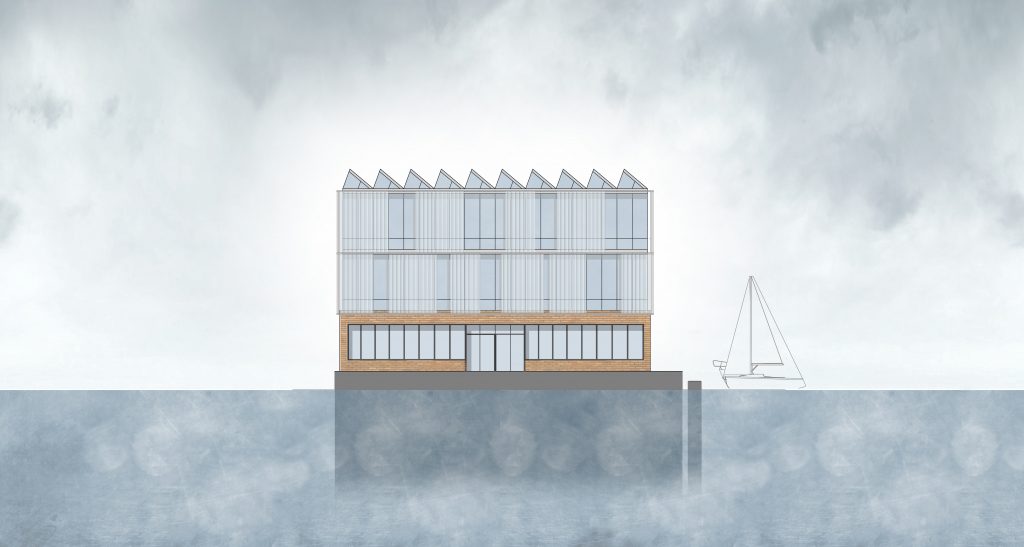
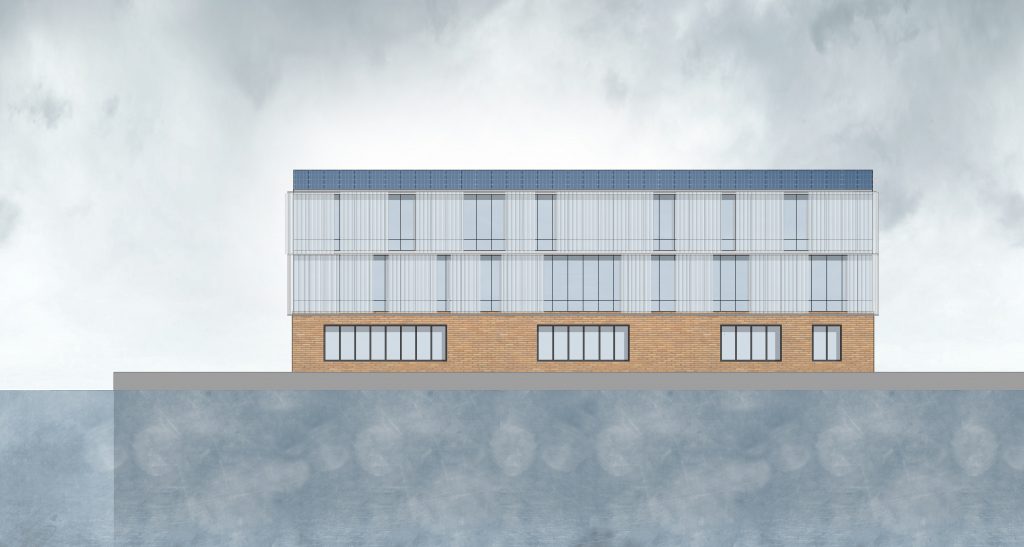
Building generation
Orientation along the boundary
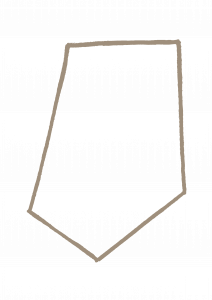
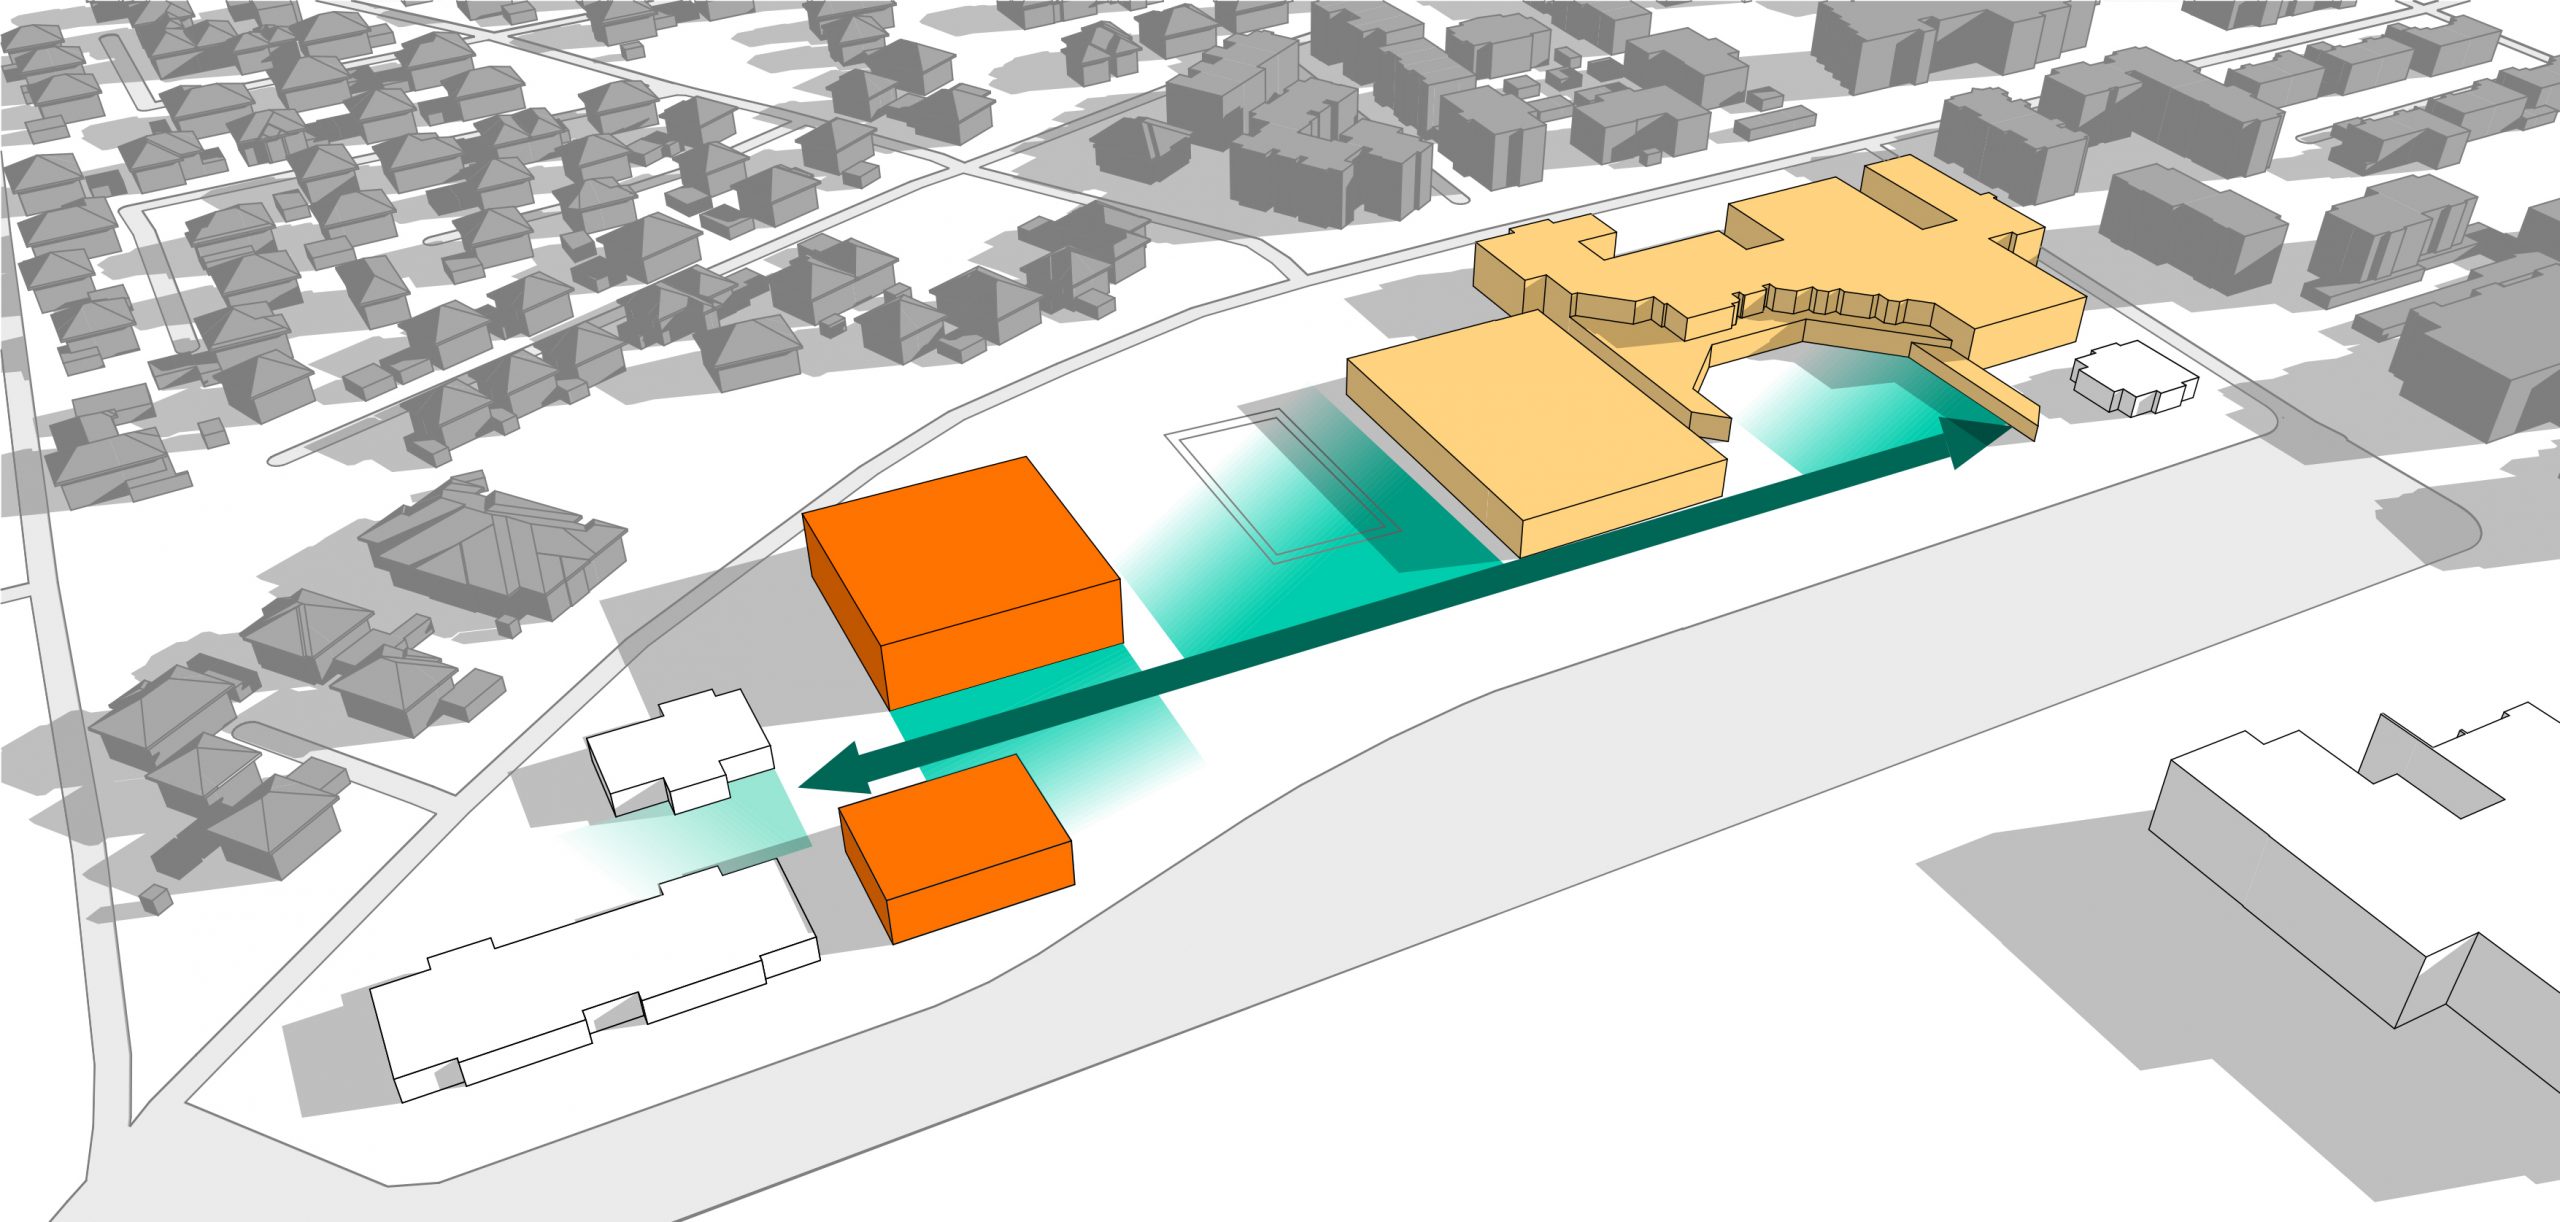
After the boundary of future development areas (a polygon) has been provided, the first thing that happens is that the buildings start emerging along its perimeter. After a while of long consideration, trial and error and reading lots of literature, I came to a conclusion, that starting from the edge is the best choice, for the following reasons.
Alignment along the street is a typical feature of urban fabric in European cities, especially if we are speaking about block typology. Block has been popular for thousands of years and is still not losing its popularity. (Reicher, 2016, p.54) In most of the cities which we perceive as the most beautiful, the facades have a clear orientation towards the street. Open spaces and the streets are “hewn out” of the solid city mass.
Leonhard Schenk, 2023, writes that all the authors – with the exception of those belonging to the Modernist movement – were in agreement that open urban space must be delimited by buildings. And if we consider the streets to be open space, they too, should be clearly defined by the buildings.
It doesn´t matter which typology the user chooses, even if it is a detached house or a row house, the orientation of an entrance towards the street is a reasonable choice, as it is easier to find addresses this way, the entrances are more visible, which creates liveliness and conveys the feeling of security even after dark (Palsson, 2020).
Christopher Alexander differentiates between “positive“ and “negative“ space. Positive are the ones partly enclosed, to the extent that their areas seem bounded. Negative spaces, on the contrary, are poorly defined, so that it is hard to tell where their boundaries are. He argues, that people feel comfortable in spaces which are “positive” and relatively uncomfortable in spaces which are “negative”. (Alexander, 1977, pp. 518–520)
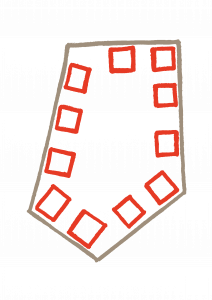
Shape variation
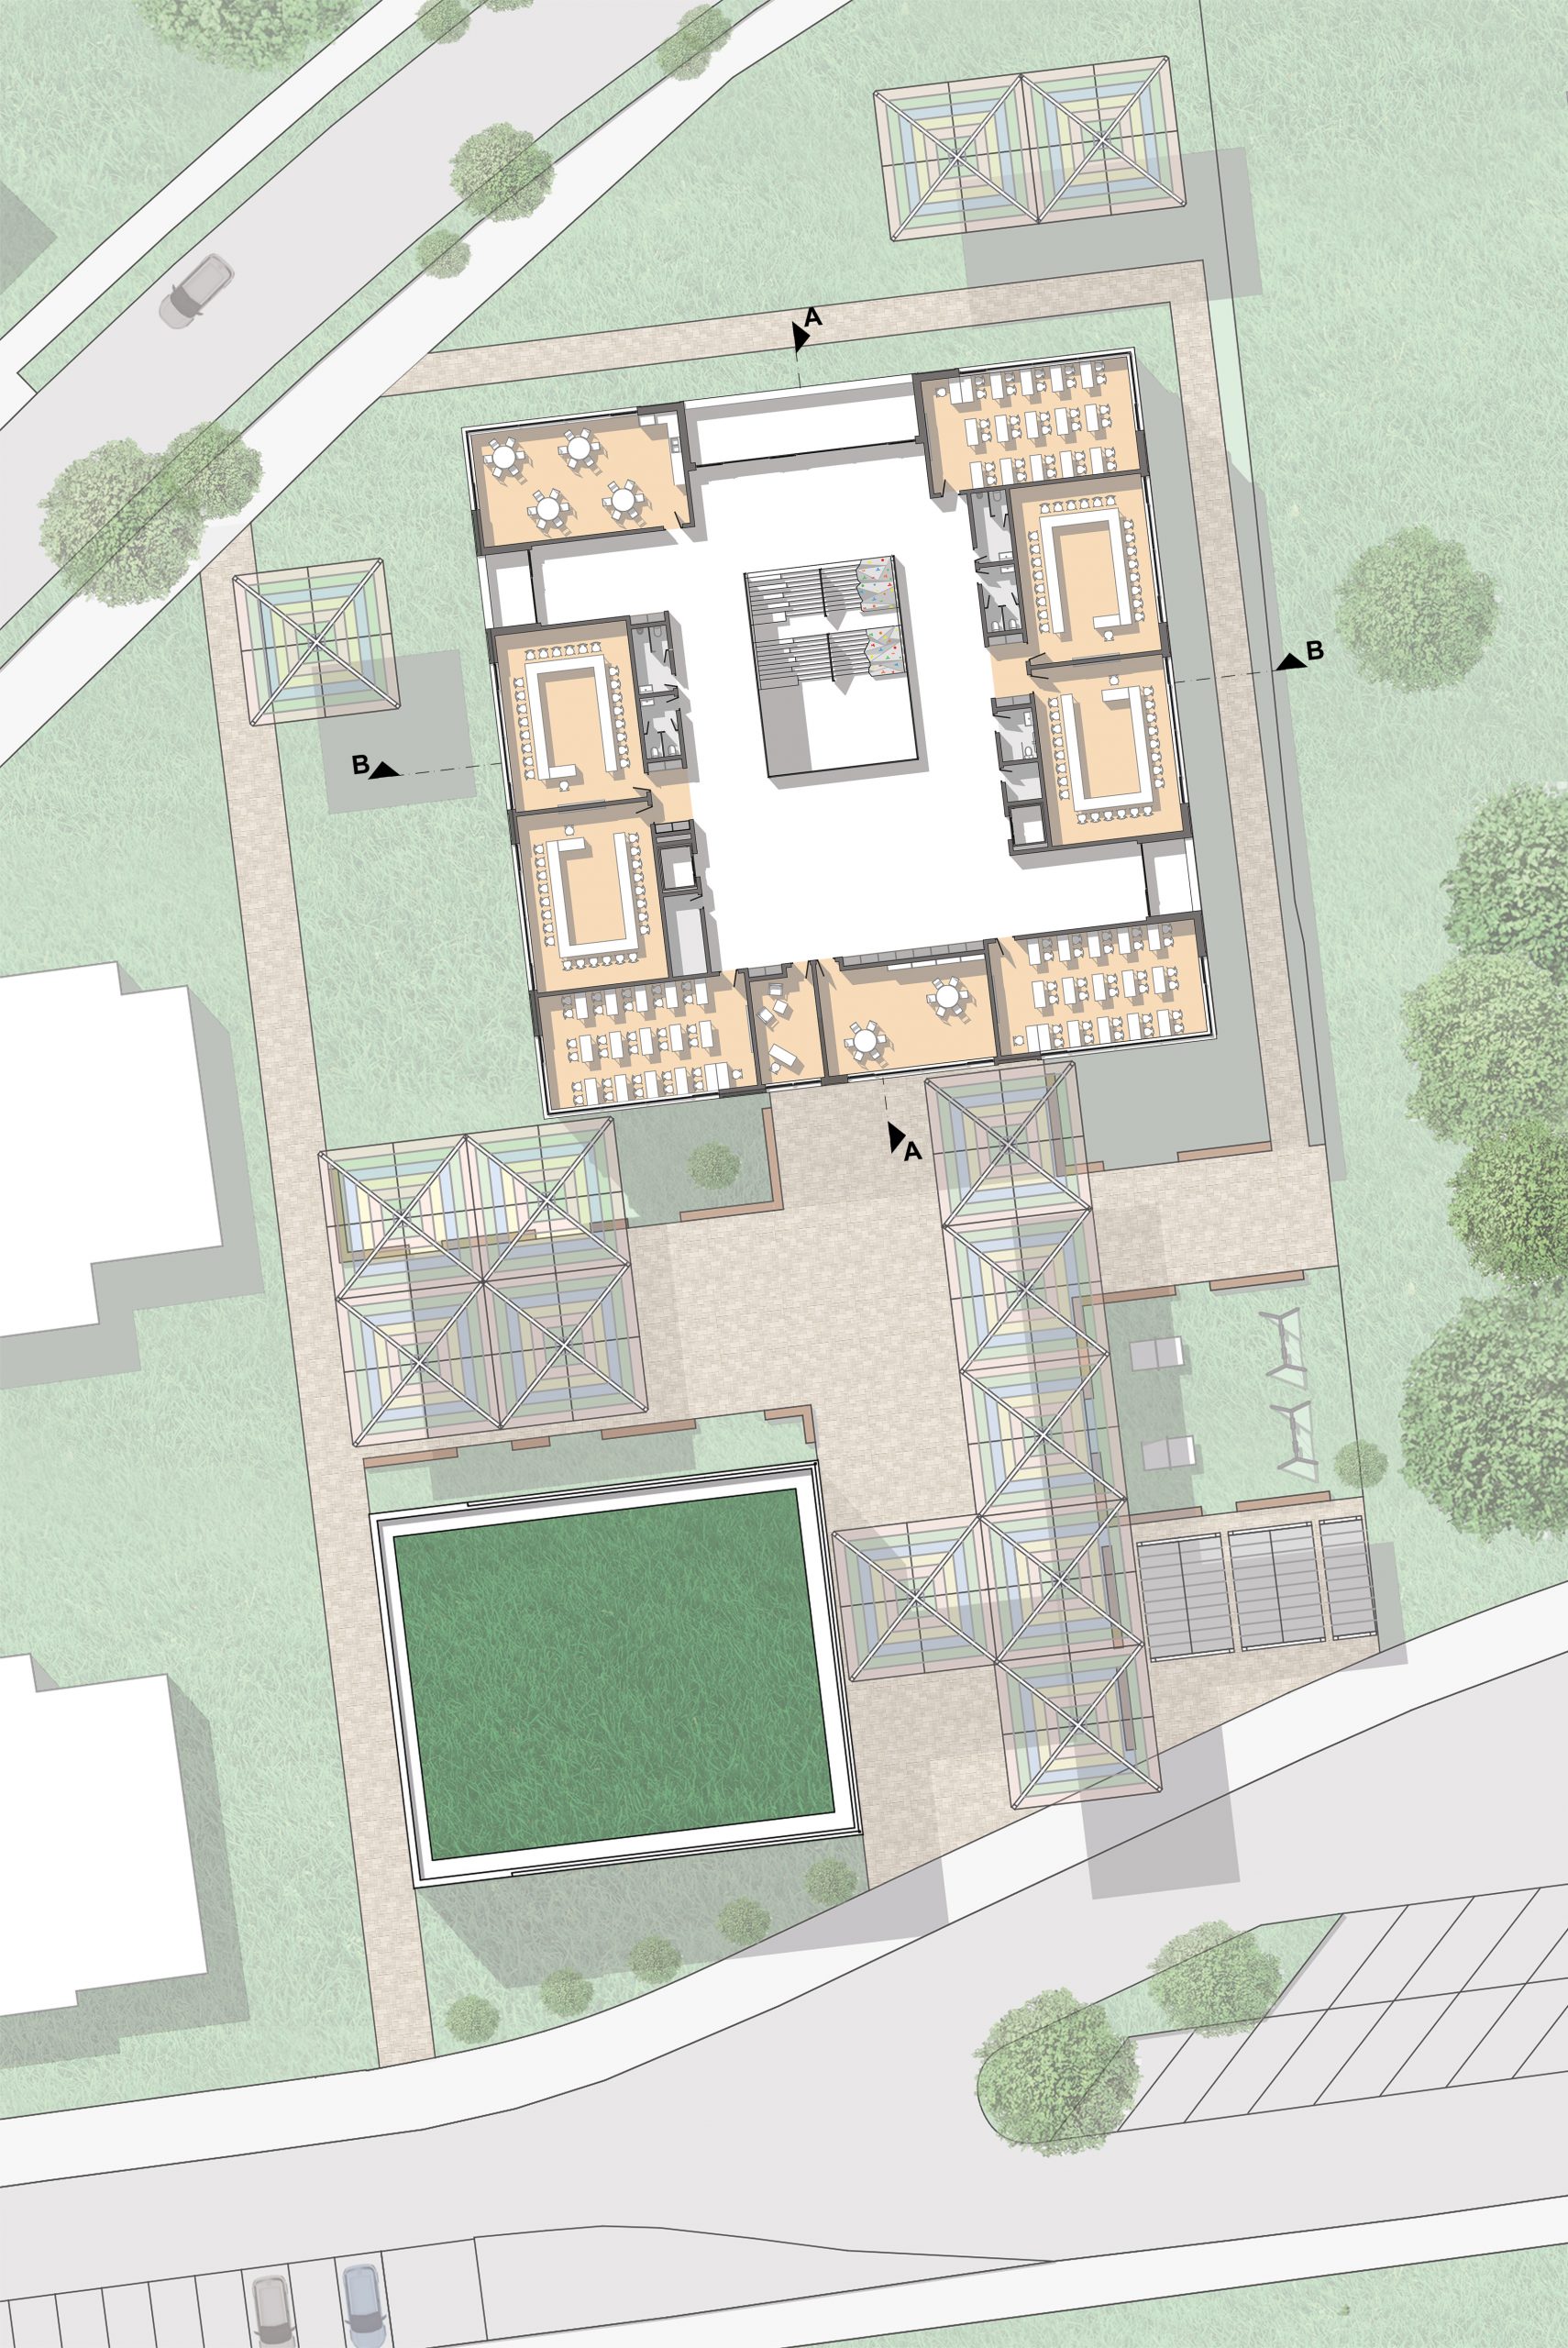
Even though the starting point of my script is to align buildings along the edges, we know that in reality the buildings are not always strictly following the street – sometimes the construction is being “cut off“ to create open space.
The data type of this variable is an integer, which equals the number of vertices for the resampling of the original boundary edges. The smaller the number, the more the new curve deviates from the original one, meaning that more open space is being created at the corners of the development area. The minimum and maximum values for this variable are 5 and 15. If the original geometry is complex or concave, you might want to set this number higher. By default, this option is set to false. But there is an option for a user to turn it on, in case one doesn´t want the buildings to strictly follow the street.
In addition, there is a possibility to cut of sharp angles from base geometry without resampling the curve. This is being done for practical and economic reasons. In reality, we can see a building with sharp angles only rarely.
When you input a development area with a sharp angle (less than 70 degrees) into a script, the polygon is being triangulated. The parts of geometry adjacent to a sharp angle is being deleted. There is a possibility to control the amount of deleted geometry based on its distance from the angle.
Placement depth and spacing
Placement depth is a uniform offset of input geometry inwards and equals the distance between the building and the edge of the development area. The user might want to increase this variable in order to create a buffer between the street and the building, a zone, which can be used, for example, as front gardens, restaurant terraces, etc.
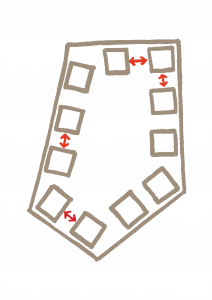
Spacing is only available for detached houses, as the buildings of other typologies are contiguous. It is equal to the distance between the houses.
Typology
The choice of typology is relatively narrow (detached houses, row houses and perimeter blocks) due to time limitations. I decided to focus on these three, because they are typical and widely used in European countries. Typologies like mat block or mat fabric might be more common for Arab cultures. In addition, high-rise solitary buildings and slab typology have been dismissed for the same reason I decided to align my start geometry along the streets – for the sake of creating “positive” space. Highrises tend to dissolve urban spaces, creating unsatisfactory, unsafe outdoor areas with a poor microclimate. (Palsson, 20, pp. 160–161) Thus, I wanted to limit the risk of this happening.
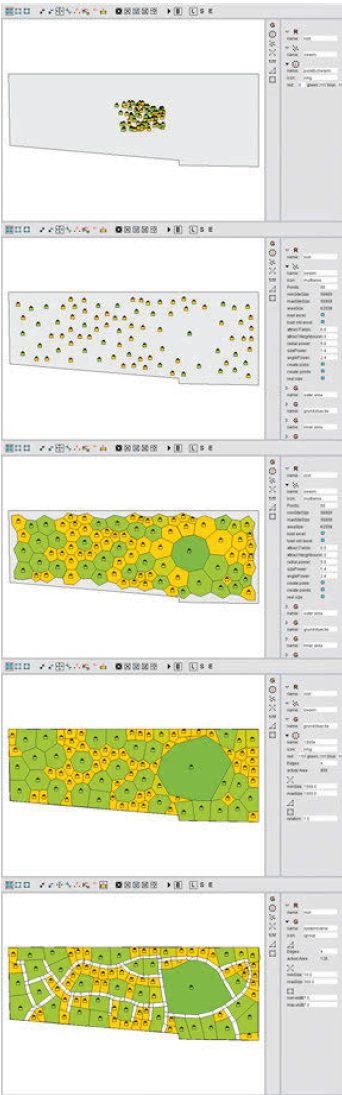
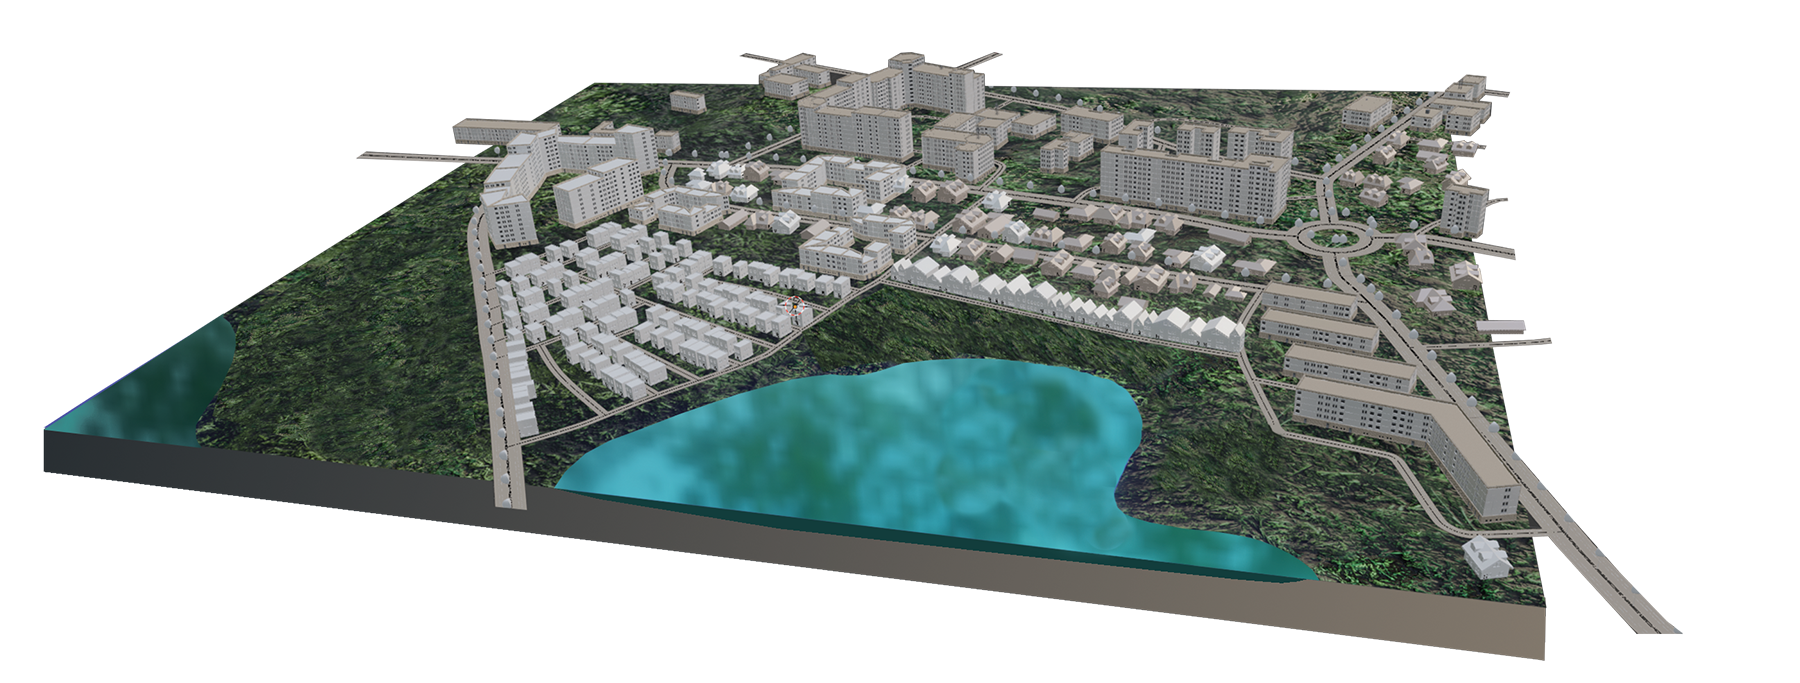
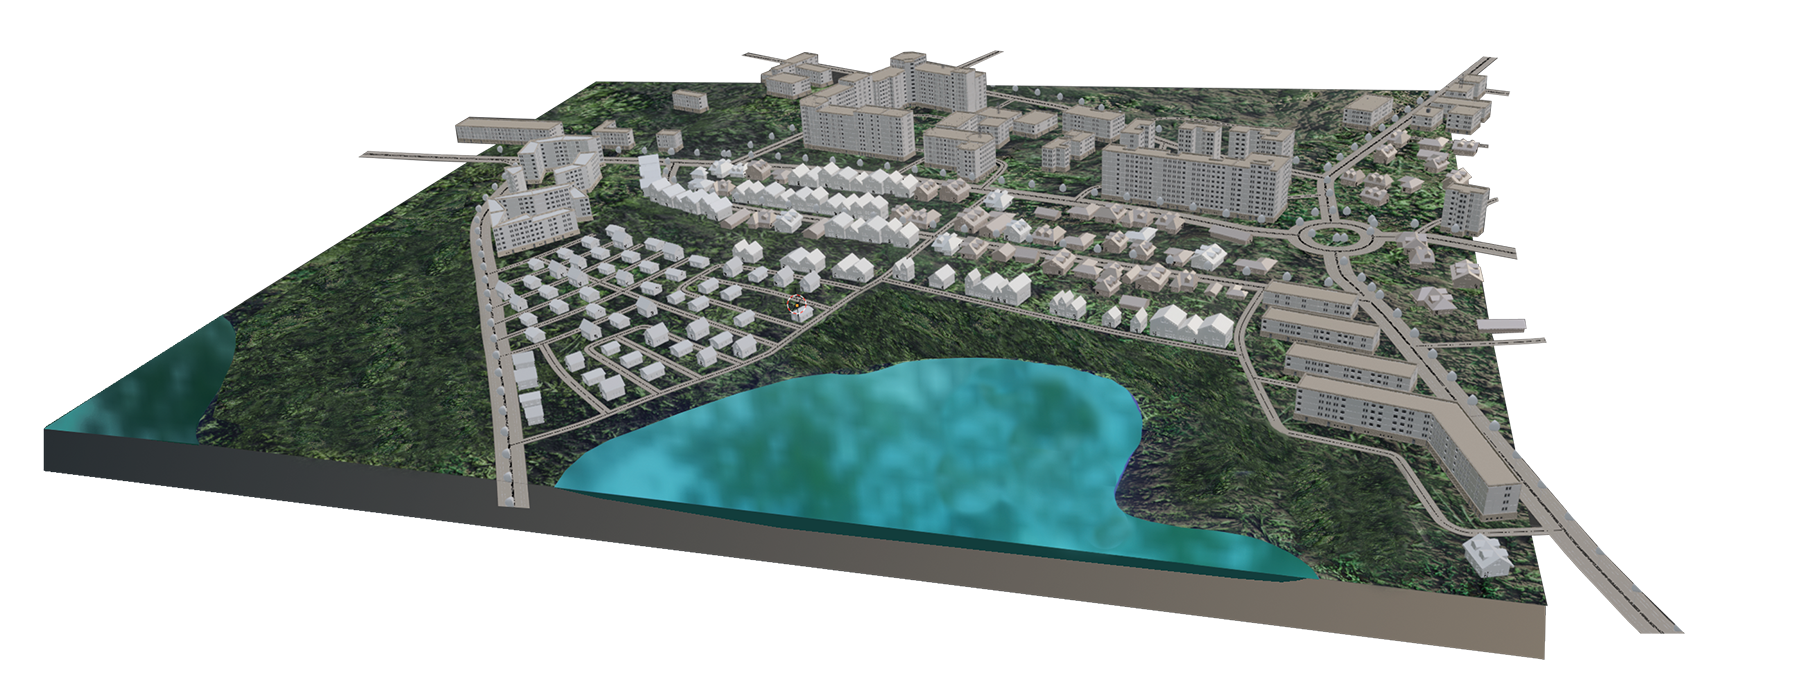
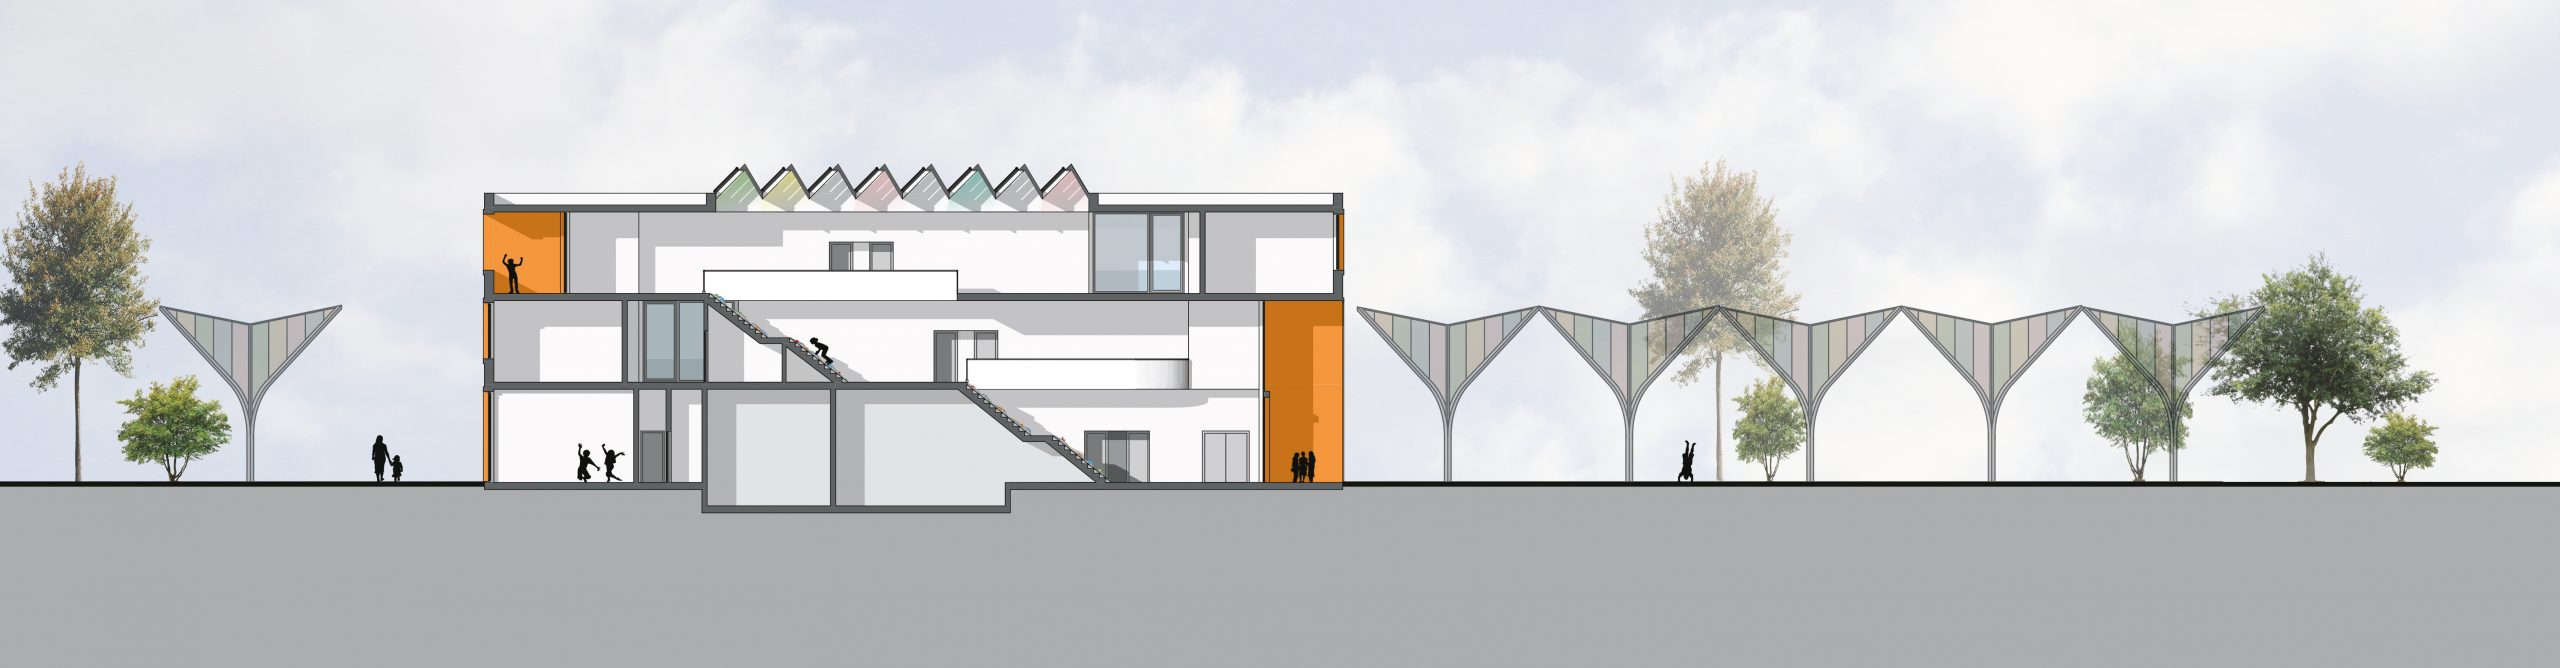
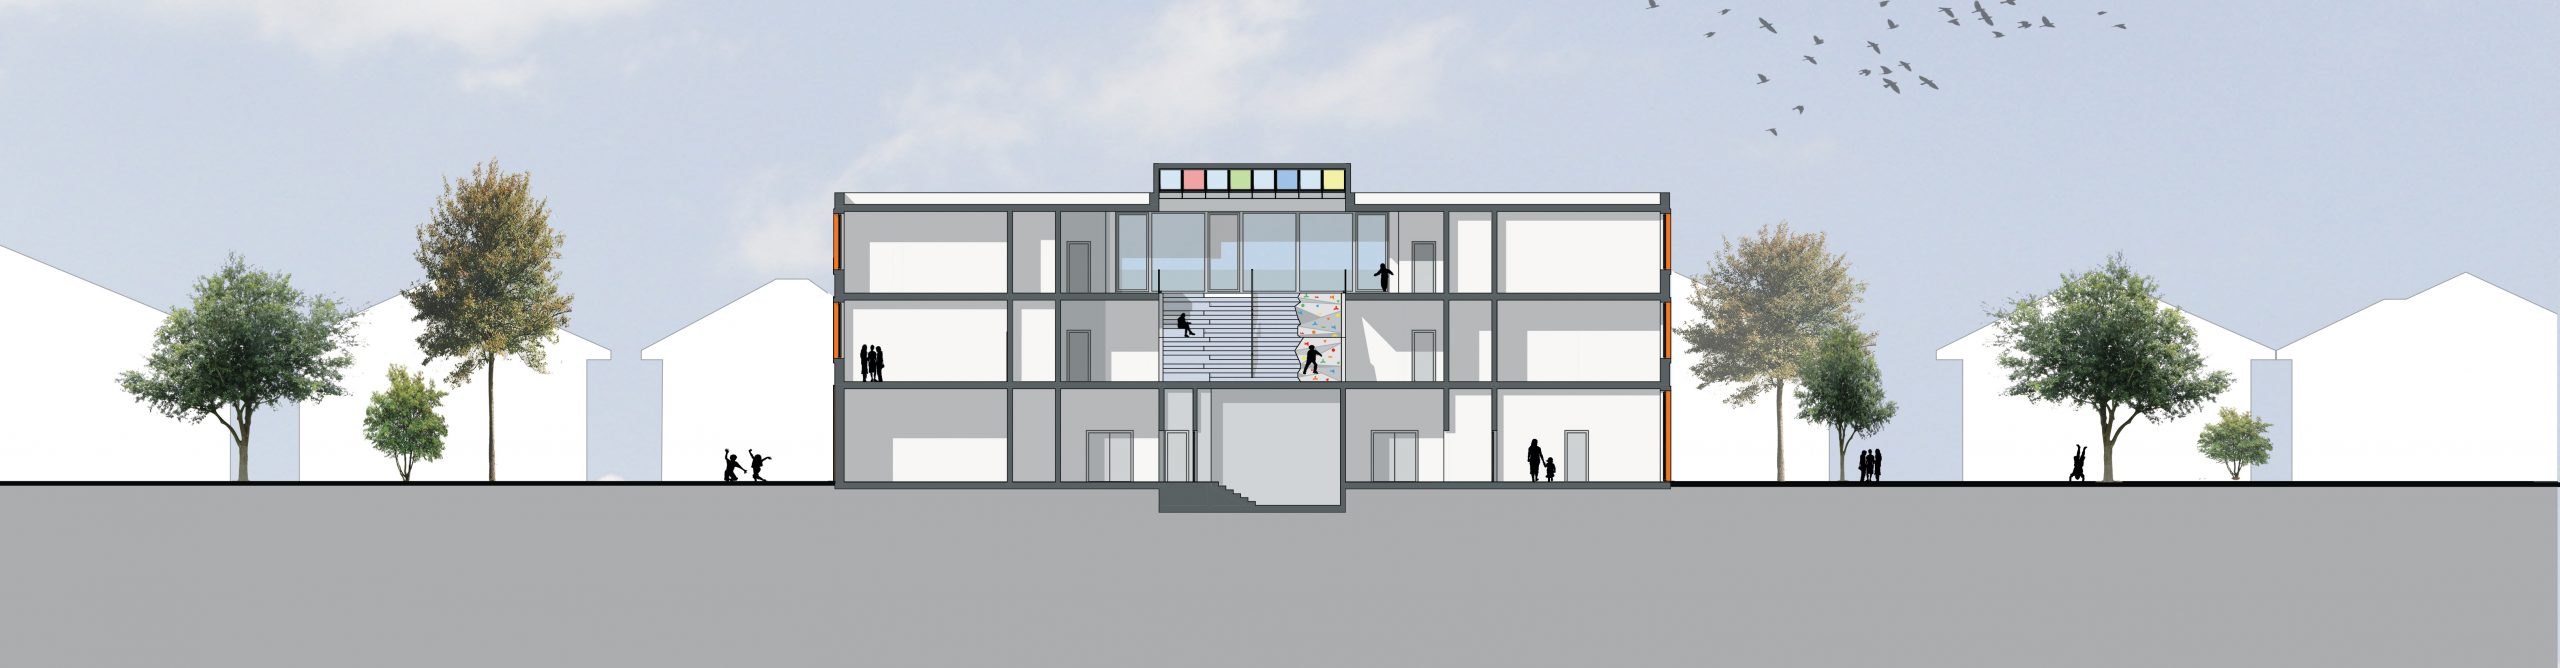
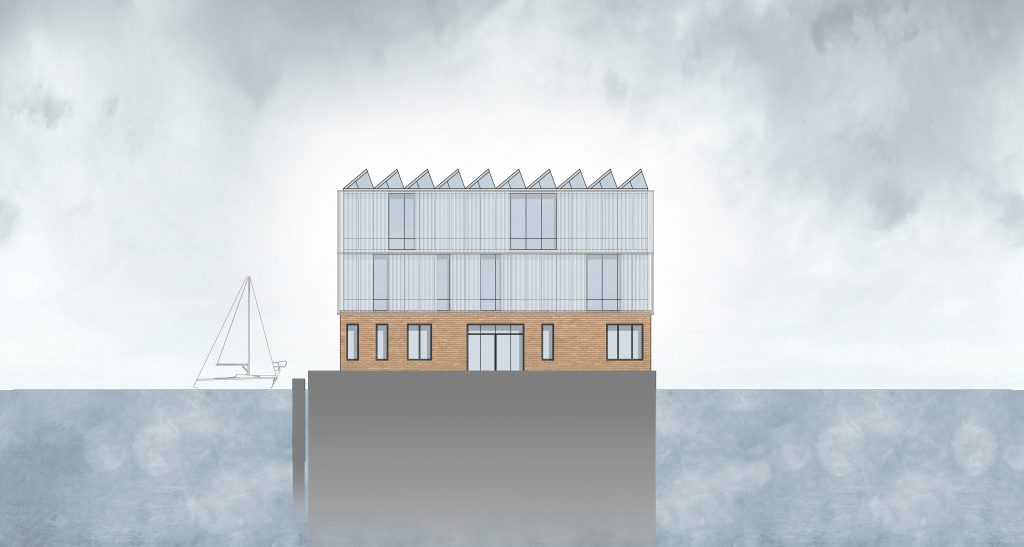
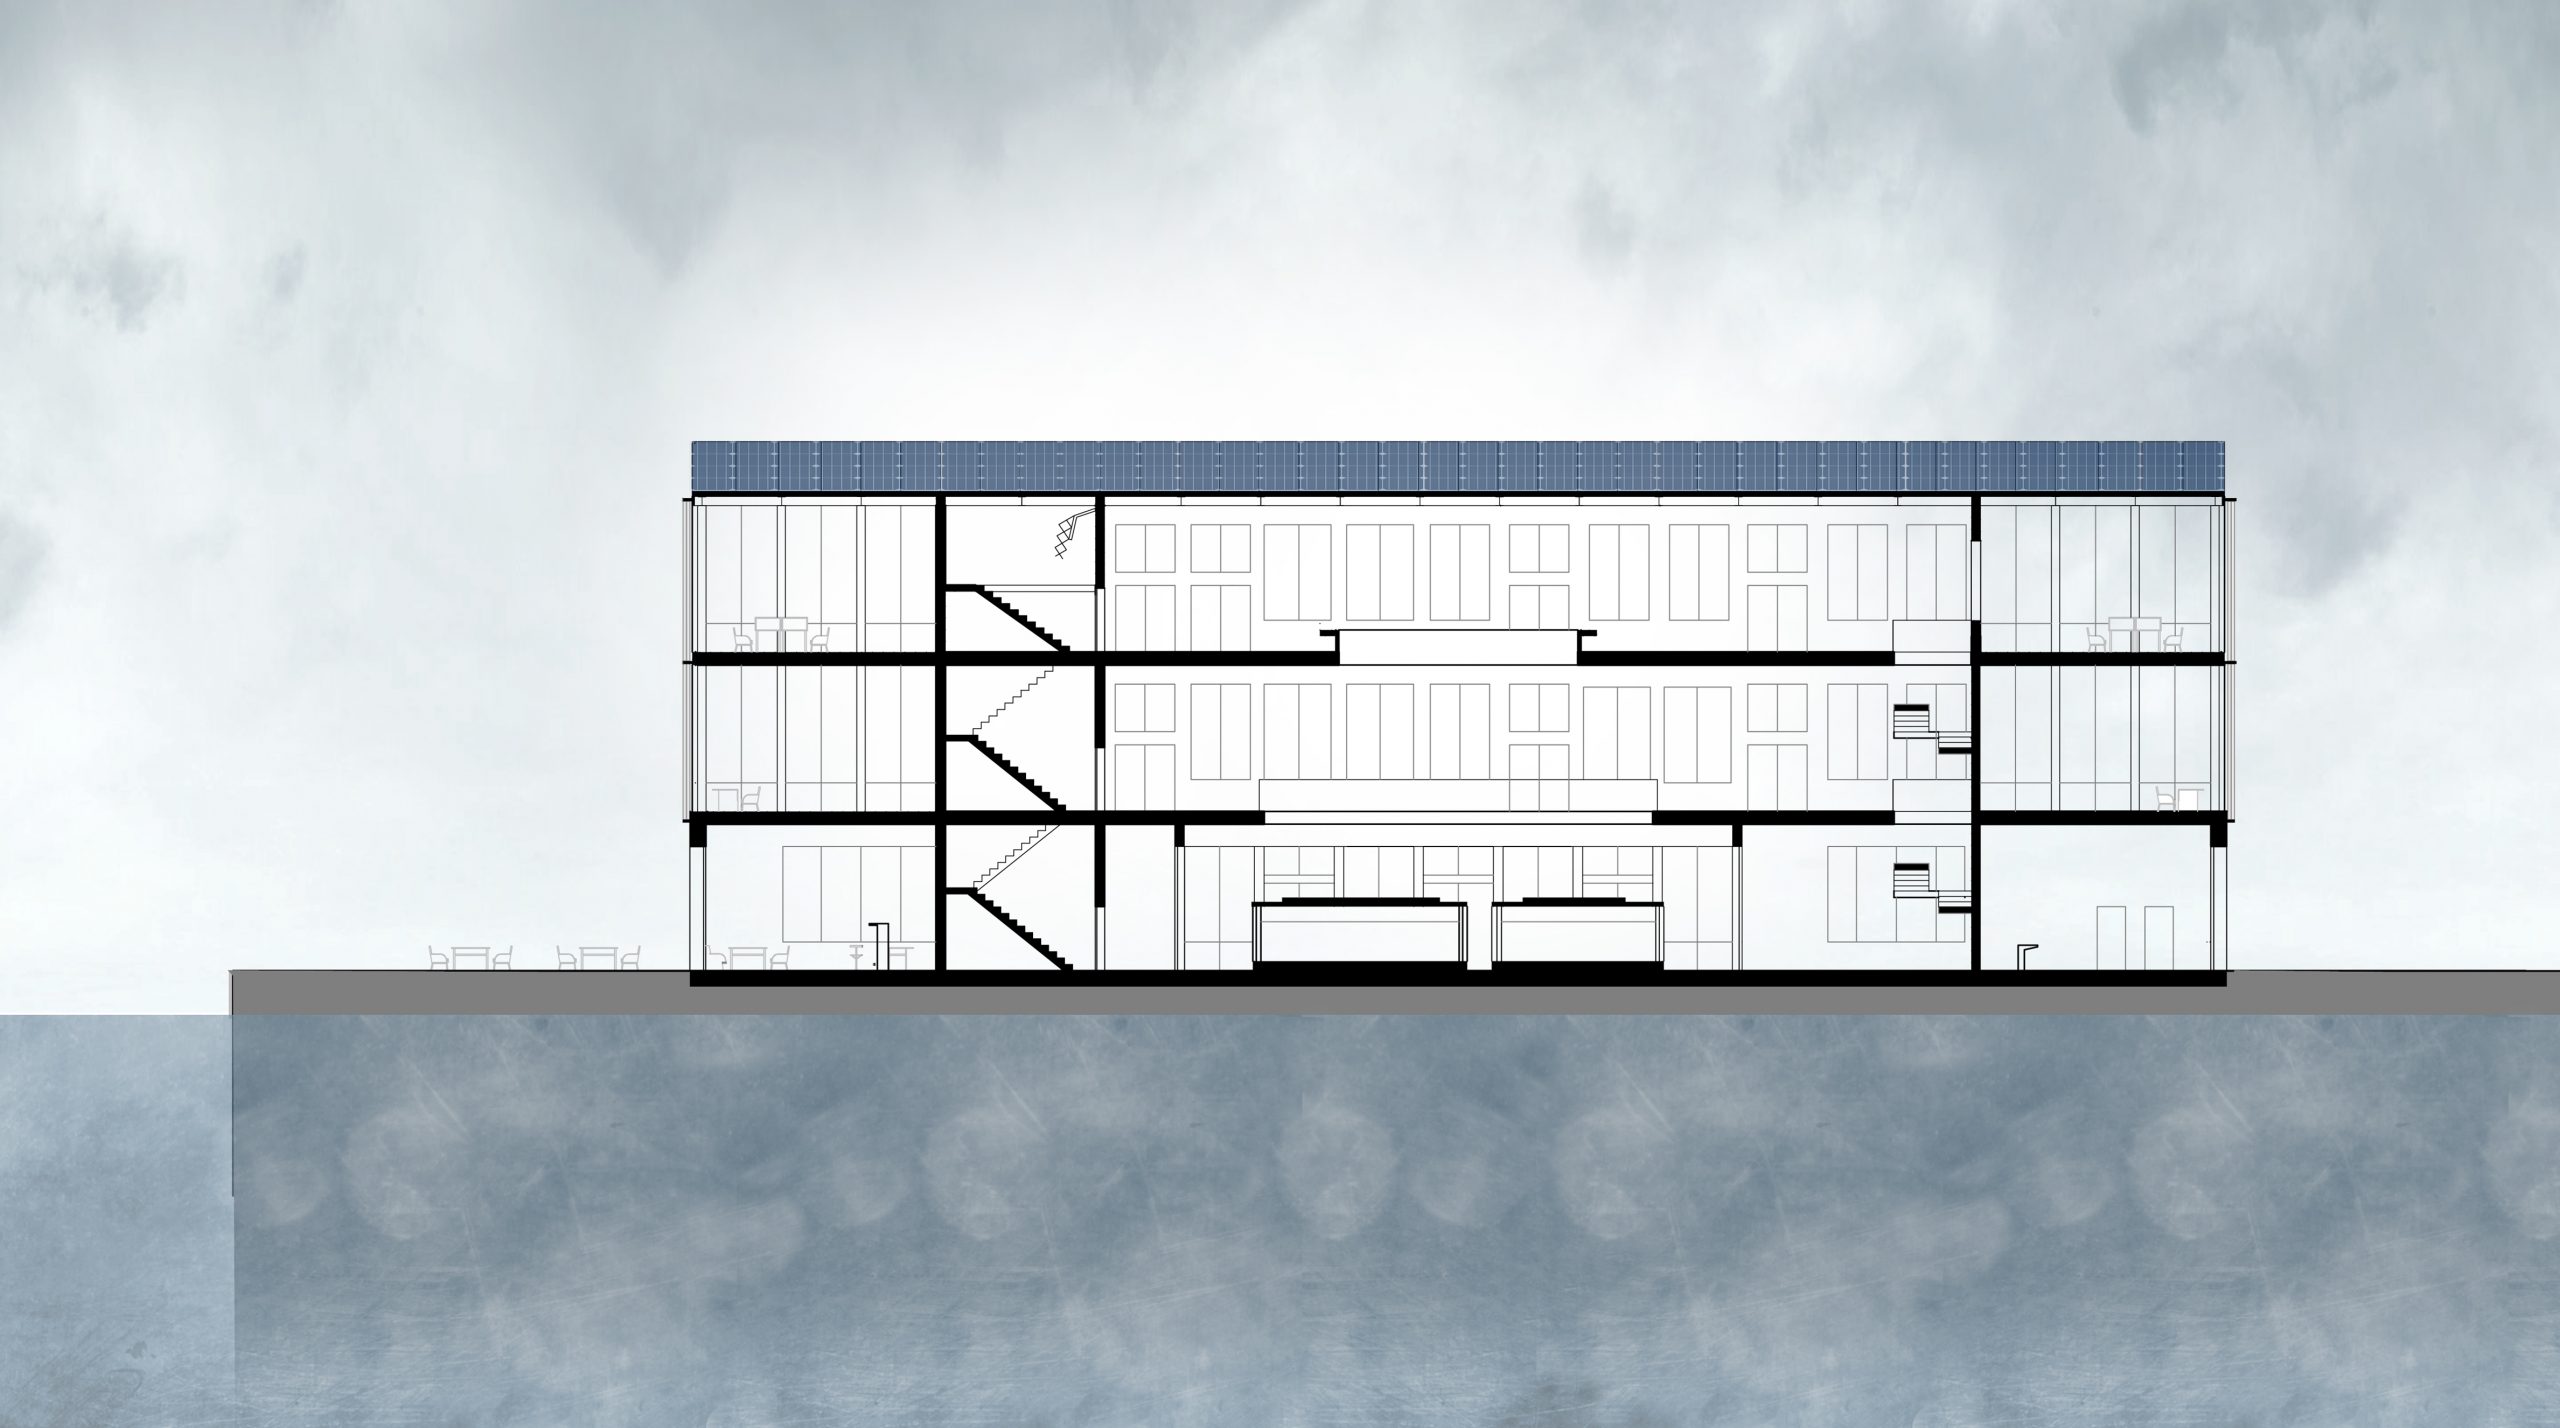
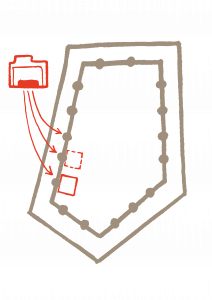
All the changes that happened to our original geometry during form variation, applying placement depth and spacing were on a 2D (XY) plane. As we have now a contour for built structure, it is time to make use of the third dimension. Creation of different typologies follows slightly different logic, although in all three cases the script is working with “instance” data type. Instances aren´t real geometry, just a “ghost“, a reference of a mesh objects (3D models) from a corresponding collection(s). The house shape itself isn´t being created by script, instead, the assets of my file include collections with manually created 3D models for each typology. Even though it is not the most parametric decision, this approach has advantages which I will explain at the end. The purpose of instancing, according to Blender developers, is to allow for much complexer geometries without increasing RAM utilization.
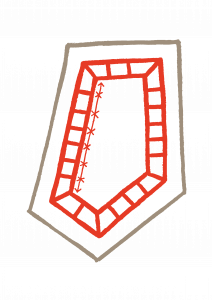
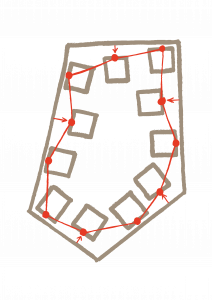
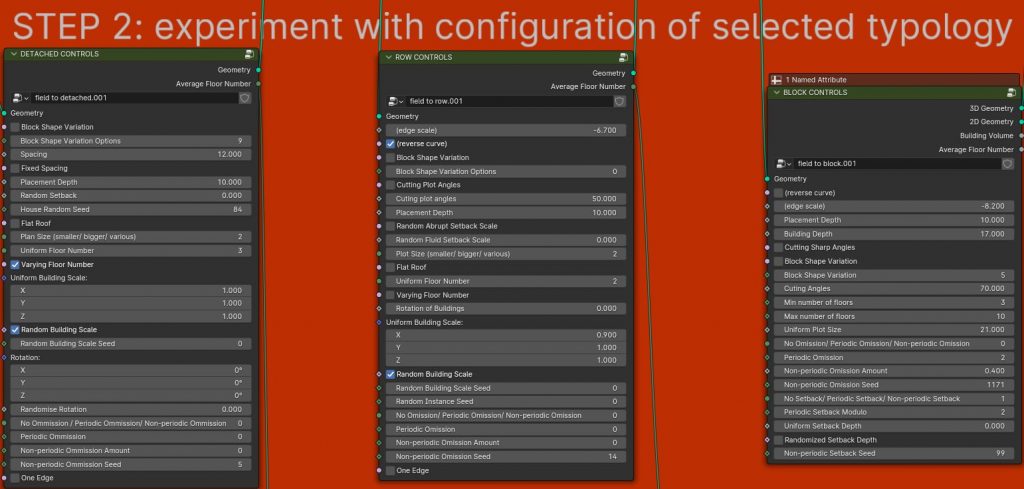
Detached houses: Each house is an instanced object from asset collections, being distributed on the points domain after applying spacing variable (resampling the curve by length). Through changing other variables, like building width, number of floors and roof shape, the user sends information to a boolean math node set-up, which in turn automatically chooses from the collections that fit these requirements.
Row houses: The logic is similar to that of detached houses with one exception. Elements are being distributed along the input curve not based on resampling the input curve by length (distance), but according to the dimensions of instances´ bounding boxes. It is made in order to place the houses right next to each other, at the same time avoiding their intersection even after it has been transformed (scaled) by a user.
Block: After resampling the input curve by length to achieve the desired building width (plot size), newly created edges are being inset inwards by a vector length equal to the input variable “building depth“ to create polygons for single plots. Unlike set-ups for detached or row houses, which instance the whole houses on point domain, this part of the script takes polygons as an input and instances elements from corresponding collections at their designated spots on these polygons. It instances pillars at the corners and wall modules between those corners along the edges. Then, according to the variable “floor number“, it stacks more similar modules on top.
Even though the choice is limited to only three main typologies, it is still possible to achieve a great variety of atmospheres and impressions. A user can start with a simple perimeter block, but by experimenting with different variables, especially placement depth, setback and omission, one can generate something resembling cluster typology or even solitary buildings (if the amount of omission is very high).
Building width
For block typology, the data type of this variable is float and it equals the width of the single building within the block. For detached and row houses it is possible to choose between smaller and bigger houses, but not to set the width directly. This is because the collections, where the script is instancing the objects from, are limited. More variety in terms of building width for these typologies can be achieved through scaling (transformation).
“The more monolithic a building is, and the less differentiated, the more it presents itself as an inhuman, mechanical factory.” (Alexander, 1977, pp. 469–470) I always suggest choosing a small plot size.
Transformation
Transformation operations include scaling and rotation, but only for detached and row houses. The scaling factors are limited to min. 0.9 and max. 1.1 of the original geometry. It is possible to scale the buildings both in a uniform way or randomly, where random factors are also between 0.9 and 1.1.
The rotation factor for row houses is limited to 0.4 radians and can only be uniform (otherwise, the houses would intersect). Detached houses can be rotated in a uniform or random way without limit.
There are no scaling or rotation options for block typology. If the user wants to change the size of buildings within the block, one can use variables “plot size“ and “floor height“ instead of scaling.
Setback
Setbacks of individual building within the urban fabric is an important feature which can drastically influence our perception of public space.
In order to combat the effect of streets driving pedestrians out and turn them into attractive places, where people want to stay, a greater sense of enclosure is needed. This can be accomplished if we make residential pedestrian streets subtly convex in plan with sitting possibilities (Alexander, 1977, p. 590)
My script isn´t made for visualizing sitting possibilities or any kind of urban furniture, but can provide various setback options for increased feeling of enclosure. I differentiate between abrupt setback (the buildings “jump“ back and forth) and fluid setback (buildings are being arranged into a smooth line), as well as periodic (repetitive) and non-periodic (random within a certain scope) setback.
Number of floors
Palsson, 2020, suggested that the building heights should be limited to five or six stories in the interest of incorporating sunlight in courtyards and streets. Christopher Alexander, 1977, even advises limiting the maximum number of floors to 4, in order to encourage better relationship between indoor and outdoor space, enable communication between parents who work inside and their children playing outside.
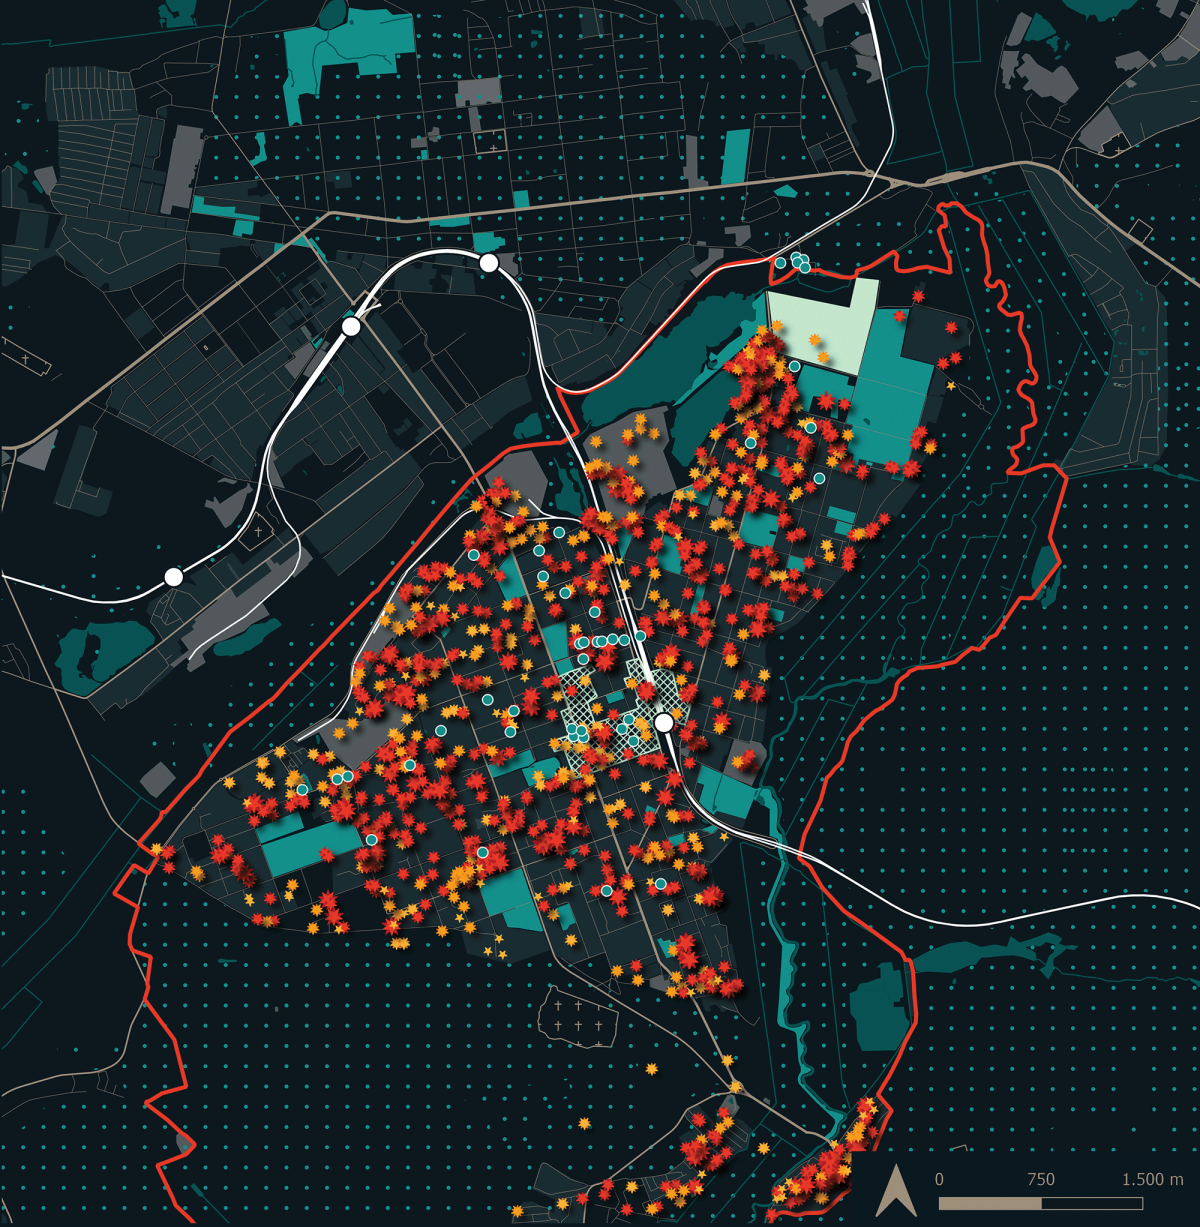
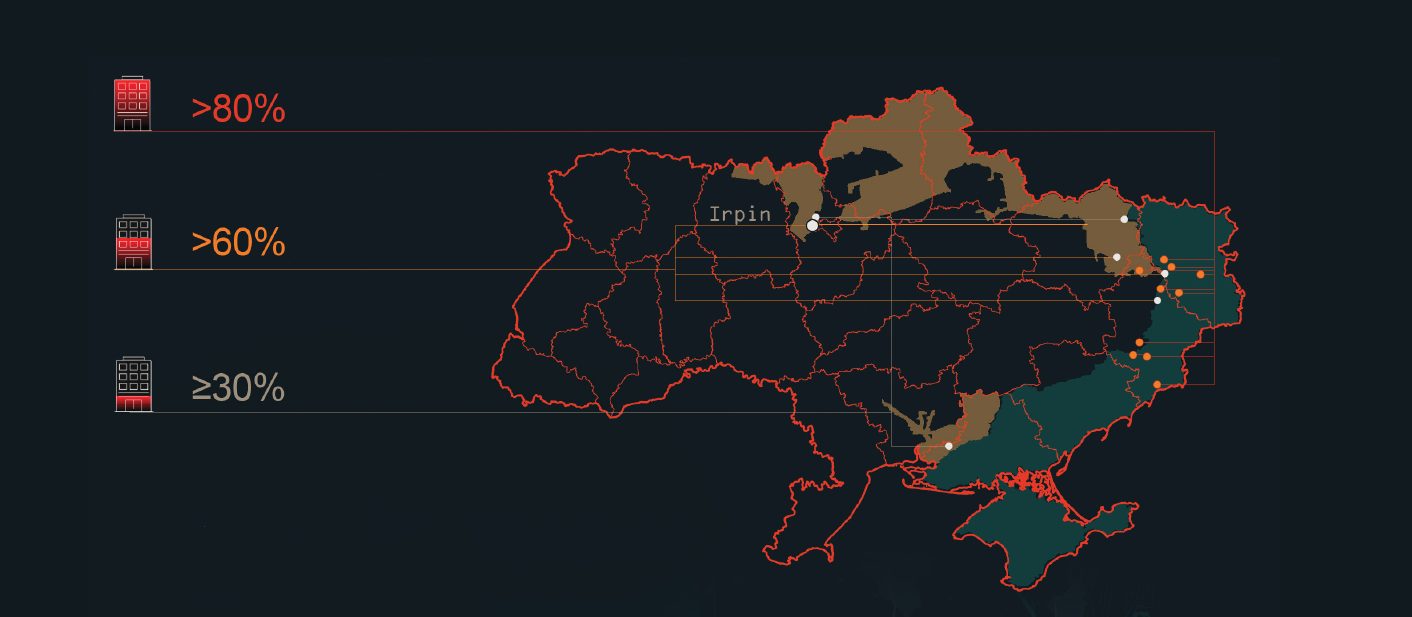
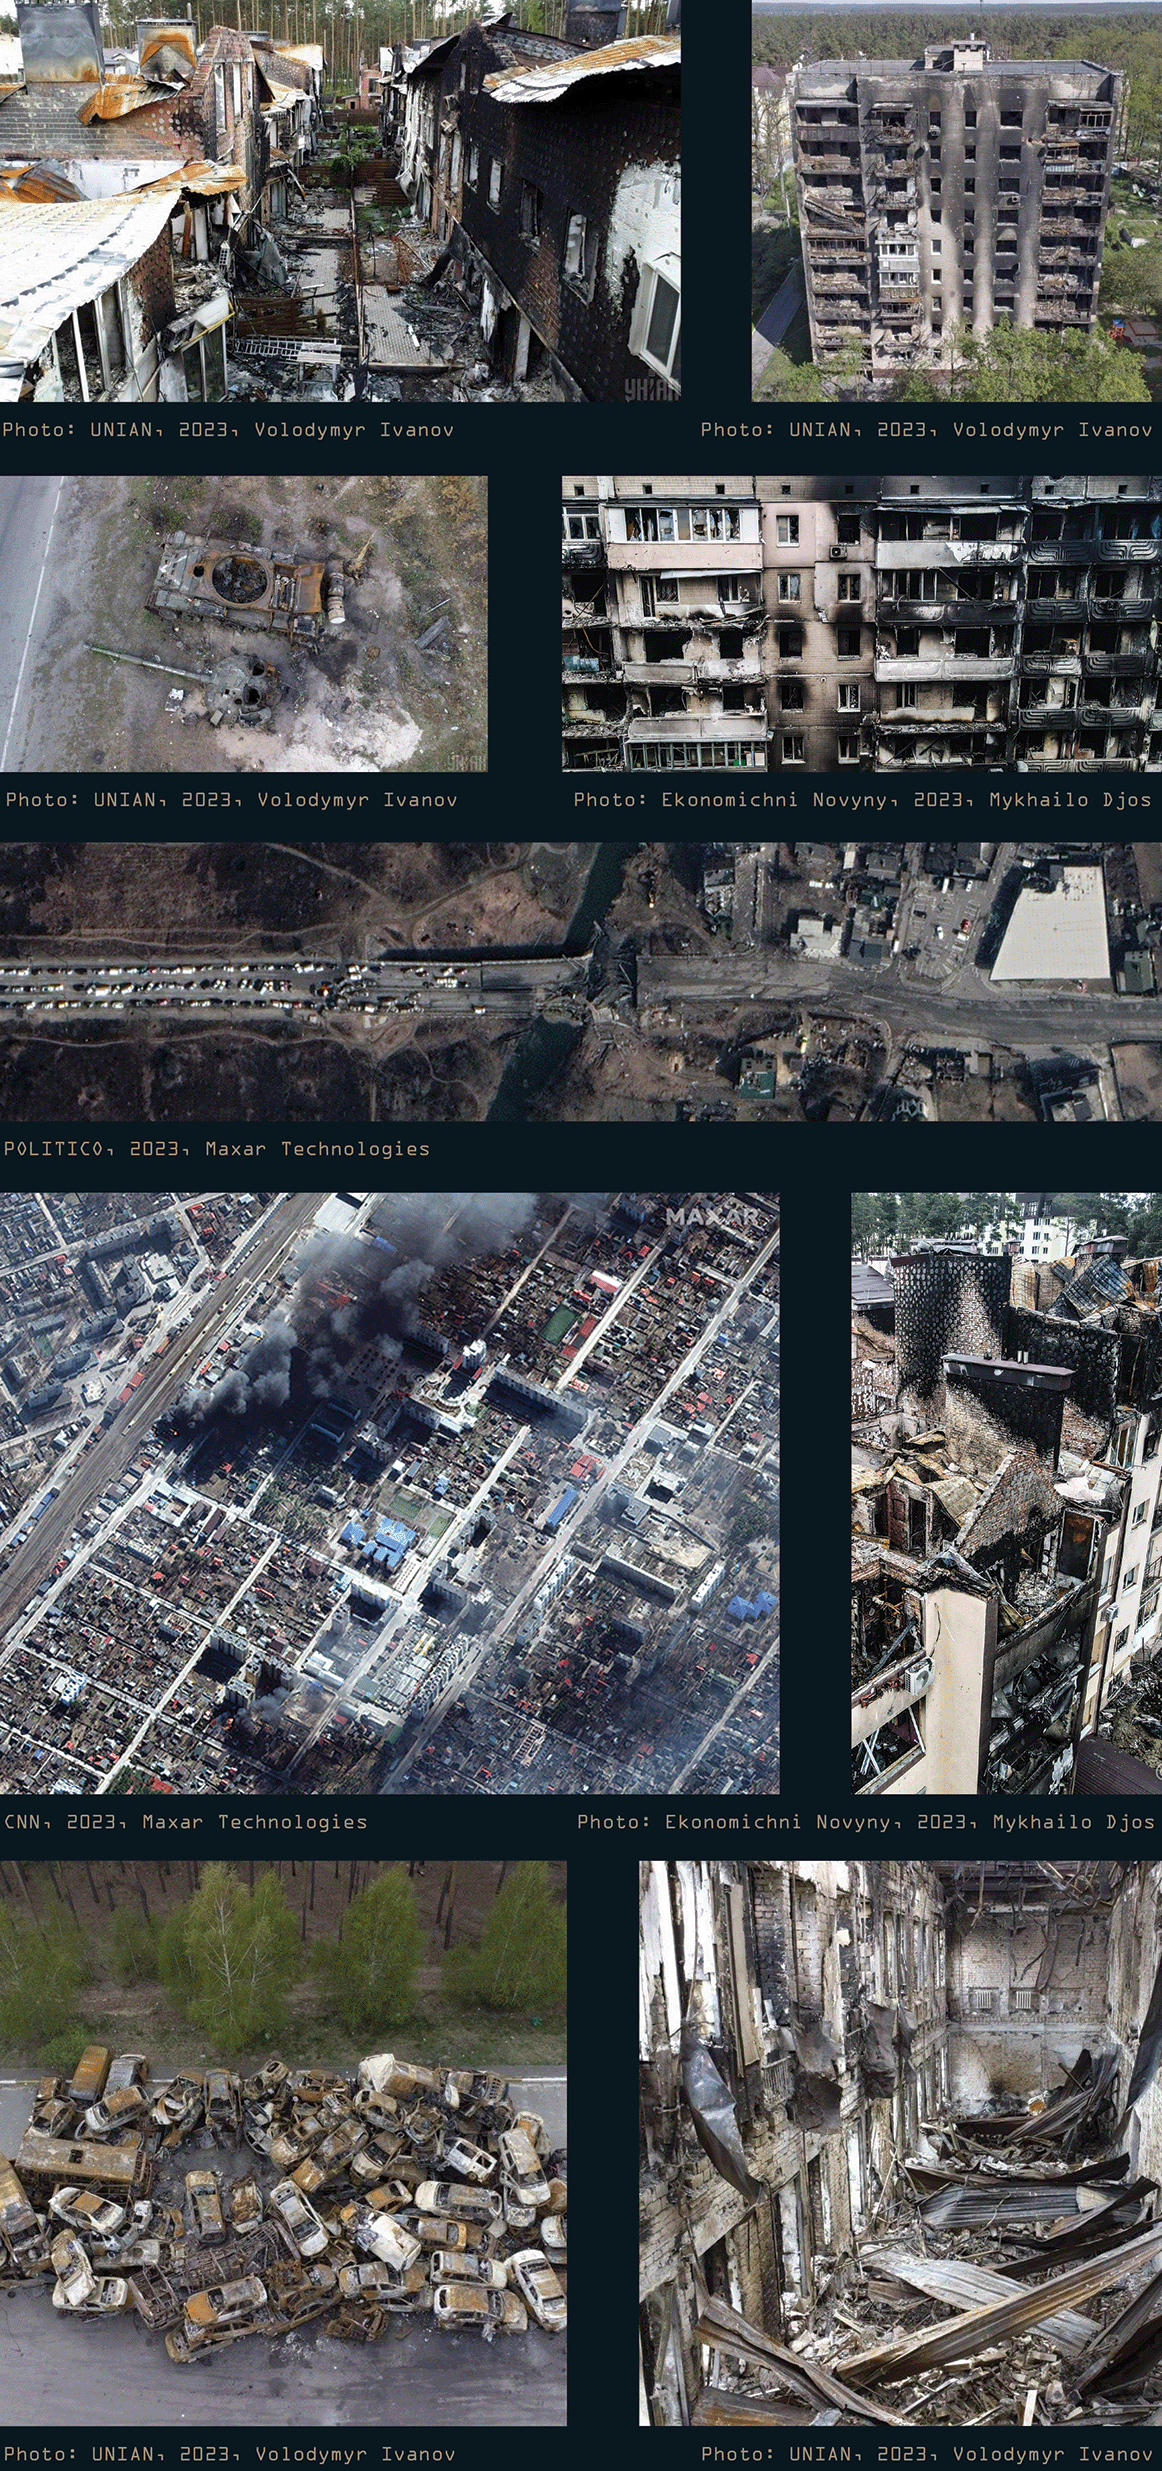
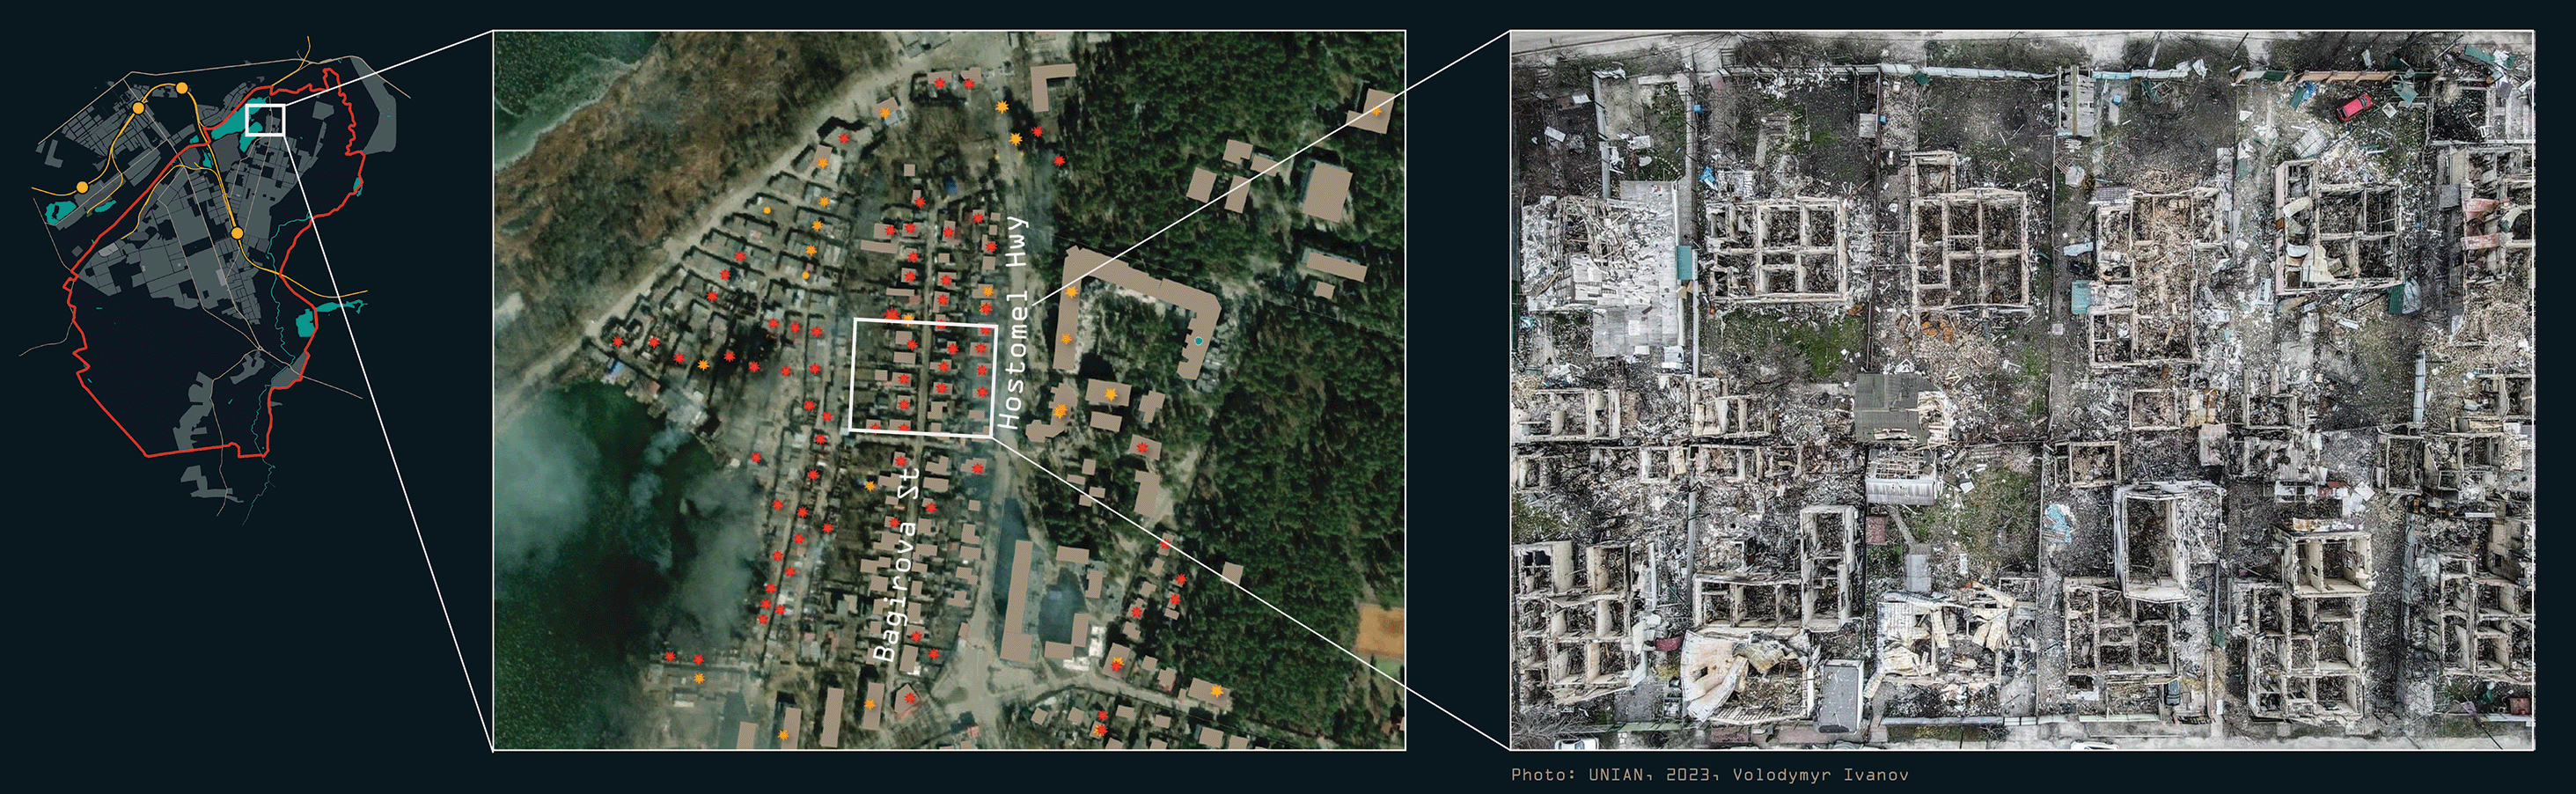
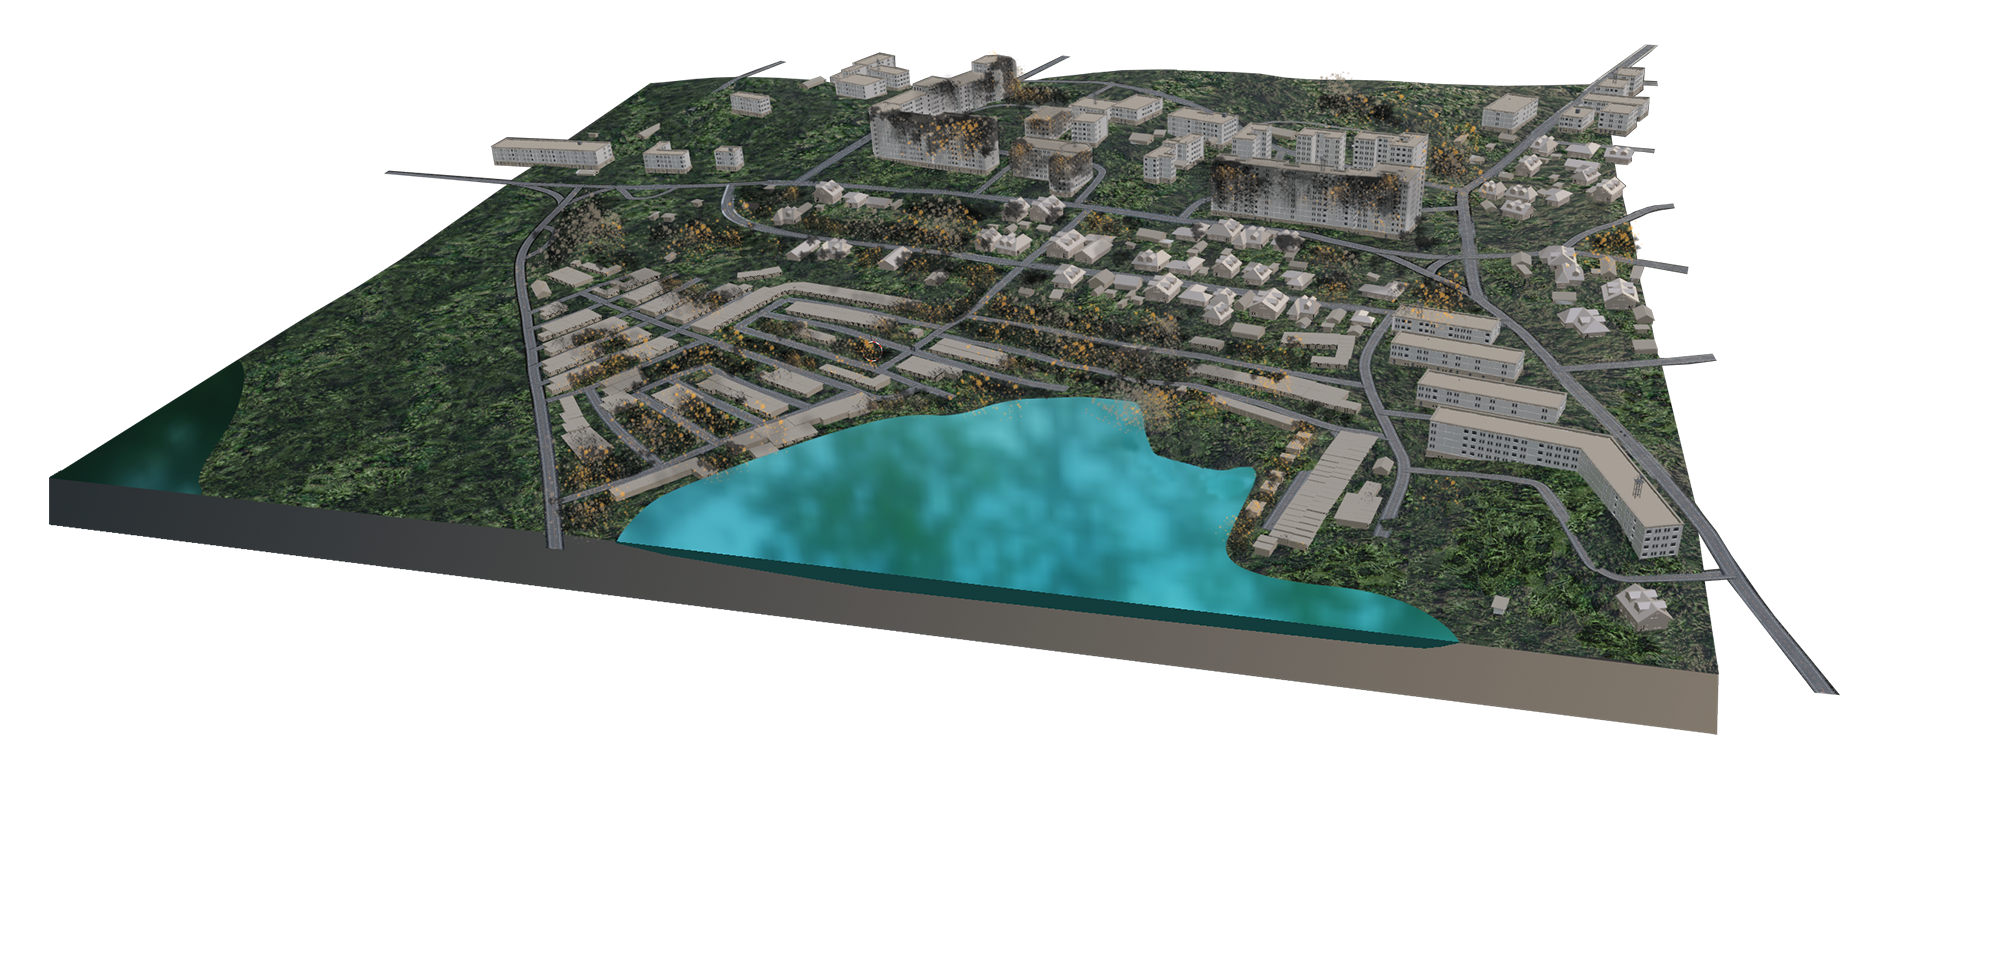
In spite of many renowned authors advocating for low building heights, I can only partially agree with these claims. Certainly, sunlight is important, but as summer temperatures hit new records every year, shady spaces can feel like a blessing. Secondly, when writing a script primarily for the use case of Irpin, I certainly wouldn´t set the limit for the floor number as low as just six storeys. Even though previously I mentioned European culture as some homogenous entity, the differences between countries regarding the preferences and experiences of citizens still exist. Physical patterns may have predictable effects in a single culture, with its stable structure of institutions and values. But it is not possible to construct a cross-cultural theory. It is even dangerous, since it will inevitably be used to impose the value of one culture on another. (Lynch, 1987, pp. 100–101) We must always reflect on the statements of others critically, even if they are icons, like Christopher Alexander. Remember that he lived during different time and in a different culture. In Ukraine, with the exception of historical city cores, high-rise blocks are very common, popular and they are not considered as something ugly or of inhumane scale. Irpin itself is a relatively new city without a low medieval city centre. It has numerous residential buildings, the height of which exceeds 10 floors. “Irpinski Lypky“, a damaged residential complex located on Hostomel highway, which is also a part of my chosen site, has been one of the most favourite and luxurious housing complexes in the city with its 10 floors and is currently being rebuilt exactly as it was before russian airstrikes. People appreciate high blocks for their ability to accommodate large closed or semi-closed courtyards, where trees (people of Irpin are very proud of their pines) can reach respectable age and height. Moreover, in a city, where the citizens value green spaces above everything, it is worth remembering that the more we build into the height, the more precious land can be saved for environmental and recreational purposes. And finally, regarding parent-child communication, believe me, Ukrainian mothers are very much capable of shouting to their kids even from the 10th. floor.
Thus, I limited the height of the block typology to 15 floors, which are not too many, in my opinion, as that buildings that already exist on site, have 10 floors. One can always go several floors higher or lower than the context, or at least having a possibility to choose so is valuable. When developing a tool for public participation, it would be a pity not to offer a broad choice of options for the stakeholders to decide from.
Detached houses can have min. one floor and max. three floors, row houses either two or three floors. Within one block it is possible to have a mix of houses with different number of floors.
Omission
Omission is a useful variable for creating space for tiny squares and pocket parks. The simplest method (but not the only one) for creating a square is to exclude one or more building lots within a design. This works regardless of the types of urban building blocks used on the site. (Schenk, 2023, p. 191)
Thanks to this feature we can also reflect temporal dimension, if we want.
I differentiate between periodic and non-periodic omission. The user can also control the amount.
Using available resources
A significant part of the script, as well as assets (collections) for creating block typology has been created by Pavel Oliva. His geometry nodes library, called “buildify“ can be downloaded for free on gumroad.
A 3D expert and a blogger with the nickname Erindale teaches Blender on youtube and provides free geometry node groups for making the lives of CG artists a little bit easier. He does an outstanding job writing meaningful algorithms. In particular, I have been using his node groups “Collections on curves“ and some others across my work.
User Guide
There are two files you can download (at the end). One includes the model of the district around Hostomel highway and Bagirova street. With it, you can experiment within the context of the site. Another file is without any context. It only includes geometry node trees for streets and development areas with arbitrary input geometries, as well as folders with typologies´ assets. Download it in case you are not interested in Irpin, but want to use my setup for your own project. Simply append this file to your project file. Select desired node trees (“Development Area“ or “Streets GN“), then both the nodes and the collections will appear in your file. It is recommended to watch a video tutorial (at the top) before using.
Nodes for streets
Simple lines, which represent road paths can be used as inputs. The geometry must be tidy, continuous and lie in XY plane. The lines should be joined by road type, so that you can control the elements of each type separately. Joined lines of every type must be on a separate layer.
Create any other object and apply the geometry nodes modifier. Geometry nodes editor must be open. Select the node “Streets GN“. Delete the geometry input of a new object.
You will see slots with an eyedropper tool for the lines of each road type. Simply click on the eyedropper and then click on your corresponding layers. Now the street geometry should appear.
In addition, you will see sliders, which control different street elements.
Experiment and enjoy!
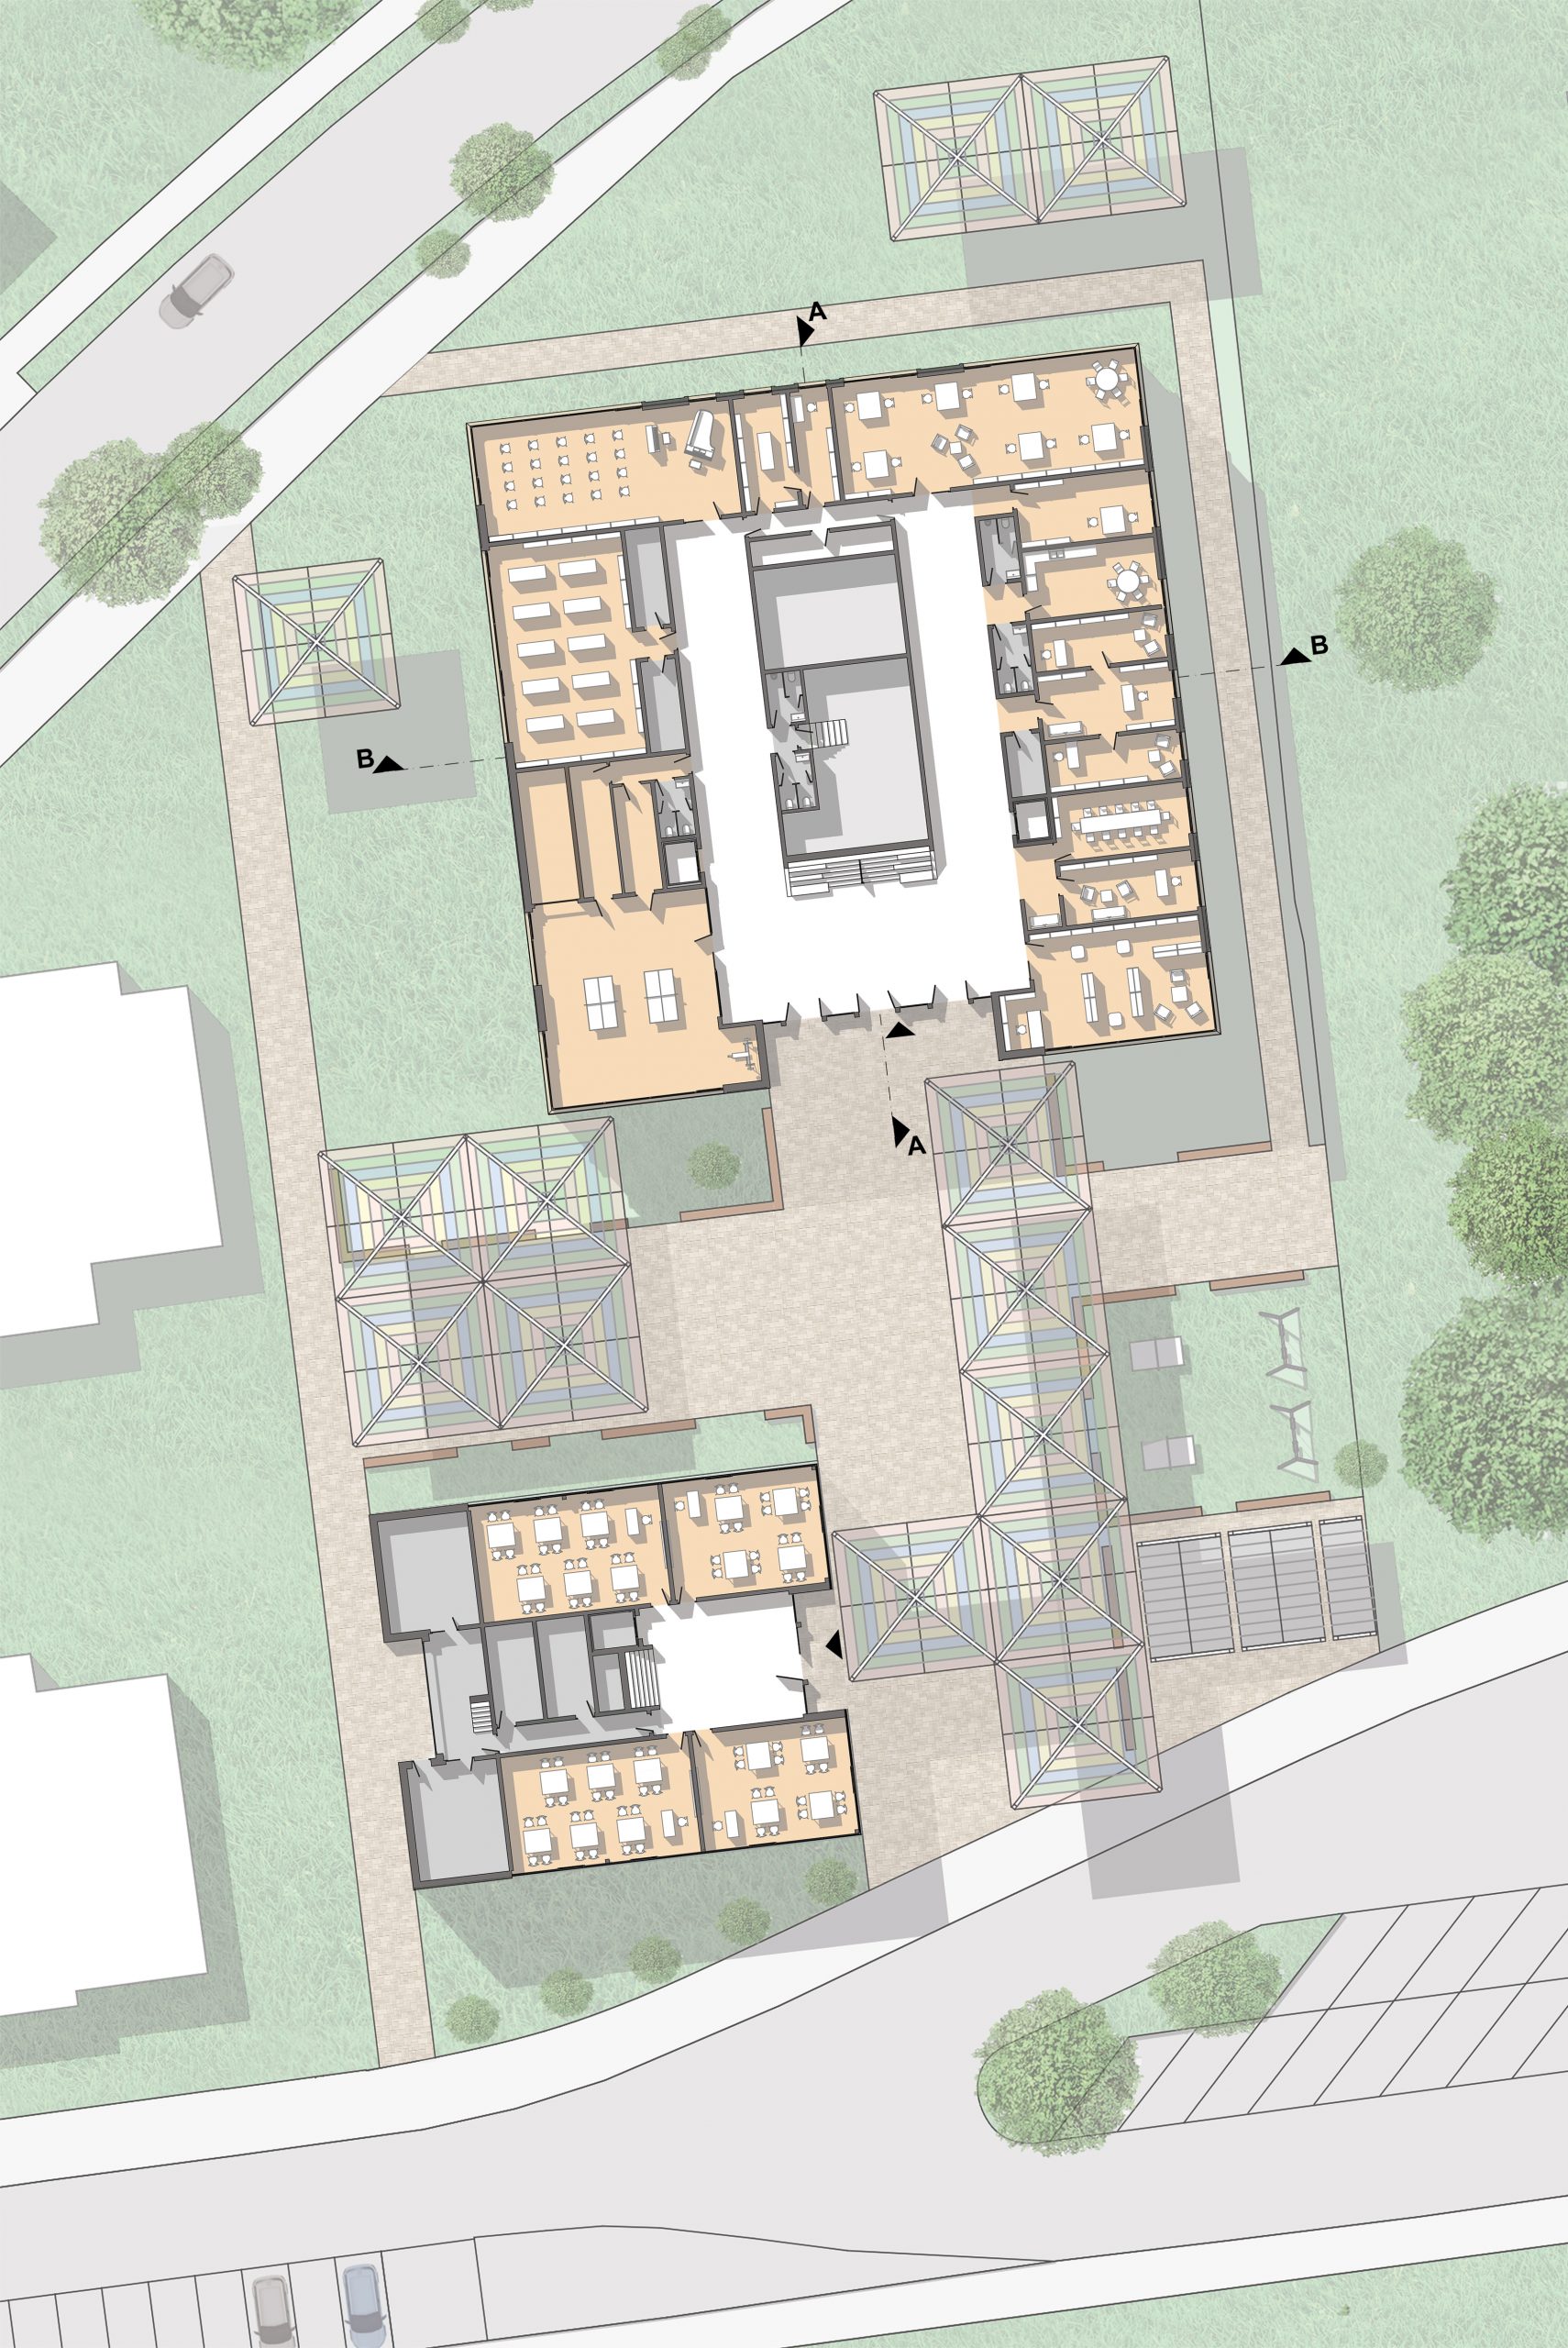
Nodes for buildings
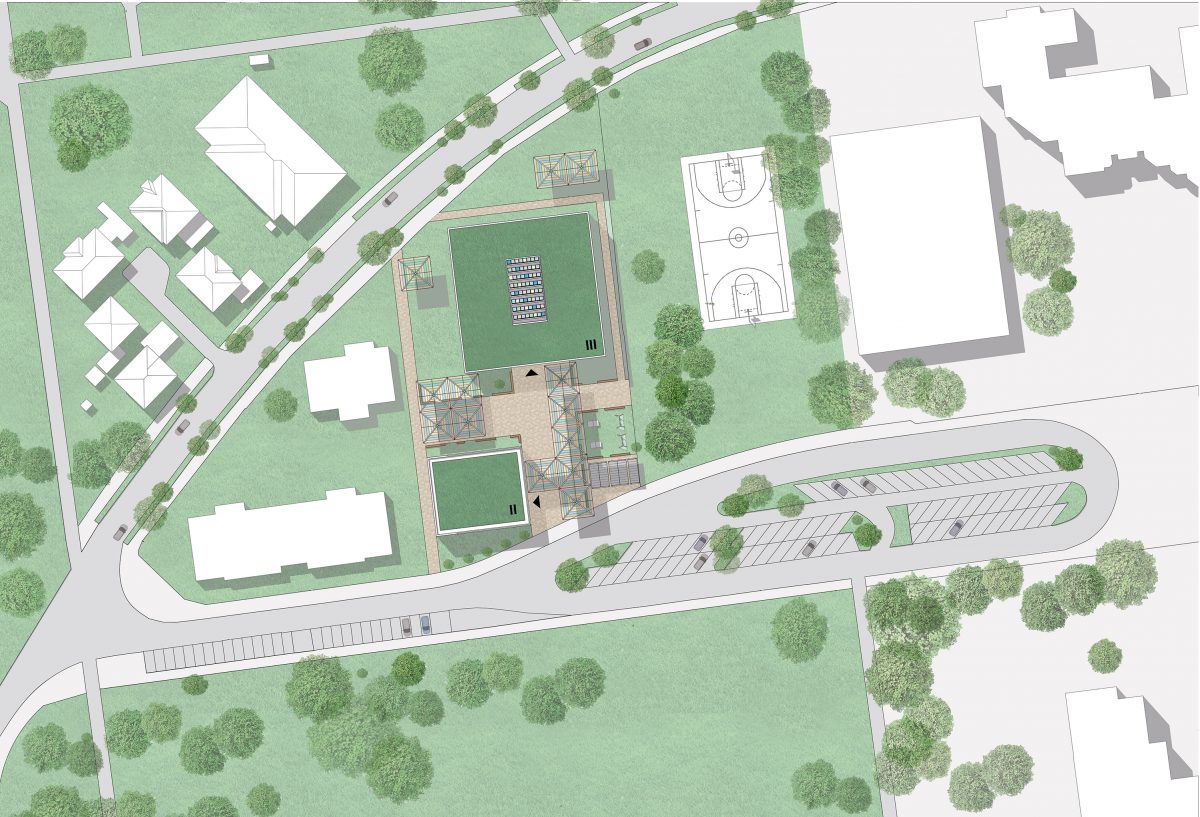
Simple, one-faced, flat polygons, which lie on a XY plane can be used as inputs. They should represent your desired development area. On it, the buildings are going to be distributed. If you have multiple development areas within your project, they should all be on separate layers. If you want your areas to have the same construction style, apply geometry nodes modifier to all of them (don´t join them!) and select the node “Development Area“. If you want the buildings to look differently in each area, make multiple copies of this node to control your development areas separately.
On the first level of controls, you can select the desired typology for the corresponding development area, as well as specify the estimated average netto living area per person. This is needed to calculate an approximate number of potential residents, that can be accommodated in this area.
In geometry nodes editor, you will not miss a big orange box with the second level of controls. There are three further nodes, through which you can control variables of your desired typology (detached, row and block). Proceed to the node, which corresponds to the typology that you selected during the first step.
Adjusting the variables of the typology you haven´t selected won´t bring any effect. Experiment with the parameters and see how 3D geometry instantly changes.
Finally, the script calculates the following outputs: an approximate number of people, building coverage ratio (BCR) and floor area ratio (FAR). To view them, turn on the attribute viewer and plug in the output you wish to inspect into the viewer´s “Value“ socket. The number will appear in a “Viewer“ column in your spreadsheet editor. In the spreadsheet editor, the same domain should be selected, as is indicated on a viewer node. It is only possible to view one output attribute at a time.
Reflexion
Limitations
Typology
This geometry nodes can only generate building typologies, popular among European countries. For other contexts, it might not be suitable. It is neither capable of creating new innovative typologies, nor does it spawn sophisticated designs. Only the most simple building shapes, only the most basic typologies and their variations are possible. In the case of a country with degraded economy, it is good enough, as every deviation from the standard would inevitably lead to increased construction costs. However, if you expect a
tool, capable of creating something the world has never seen before, this script is a bad choice.
Land use
While the user can generate many plausible options for residential blocks, this model is not suitable for large-scale commercial or industrial areas. It doesn´t have any landscaping features either. It is not a smart AI, which could come up with a vision for the
whole neighbourhood and create a vibrant land-use mix. This geometry nodes set-up simply takes an input of a development area, that the user has to provide and locates
residential buildings within it, as well as spawns street geometry onto simple lines.
Variables
Built structure can be so versatile and diverse, that no tool can possibly generate all of the possible solutions. Mine is no exception. Its strength lies within the ability of creating various plausible options quickly, but by no means can it visualize all of them. The variables, that the user can control, are strictly limited to those, described above and listed in tables. Everything else is out of scope of this project. For example, shadow calculator would be another important variable, but it is not available in the current version.
Distinctiveness: reusability, adaptability, intelligibility, accessibility
Reusability
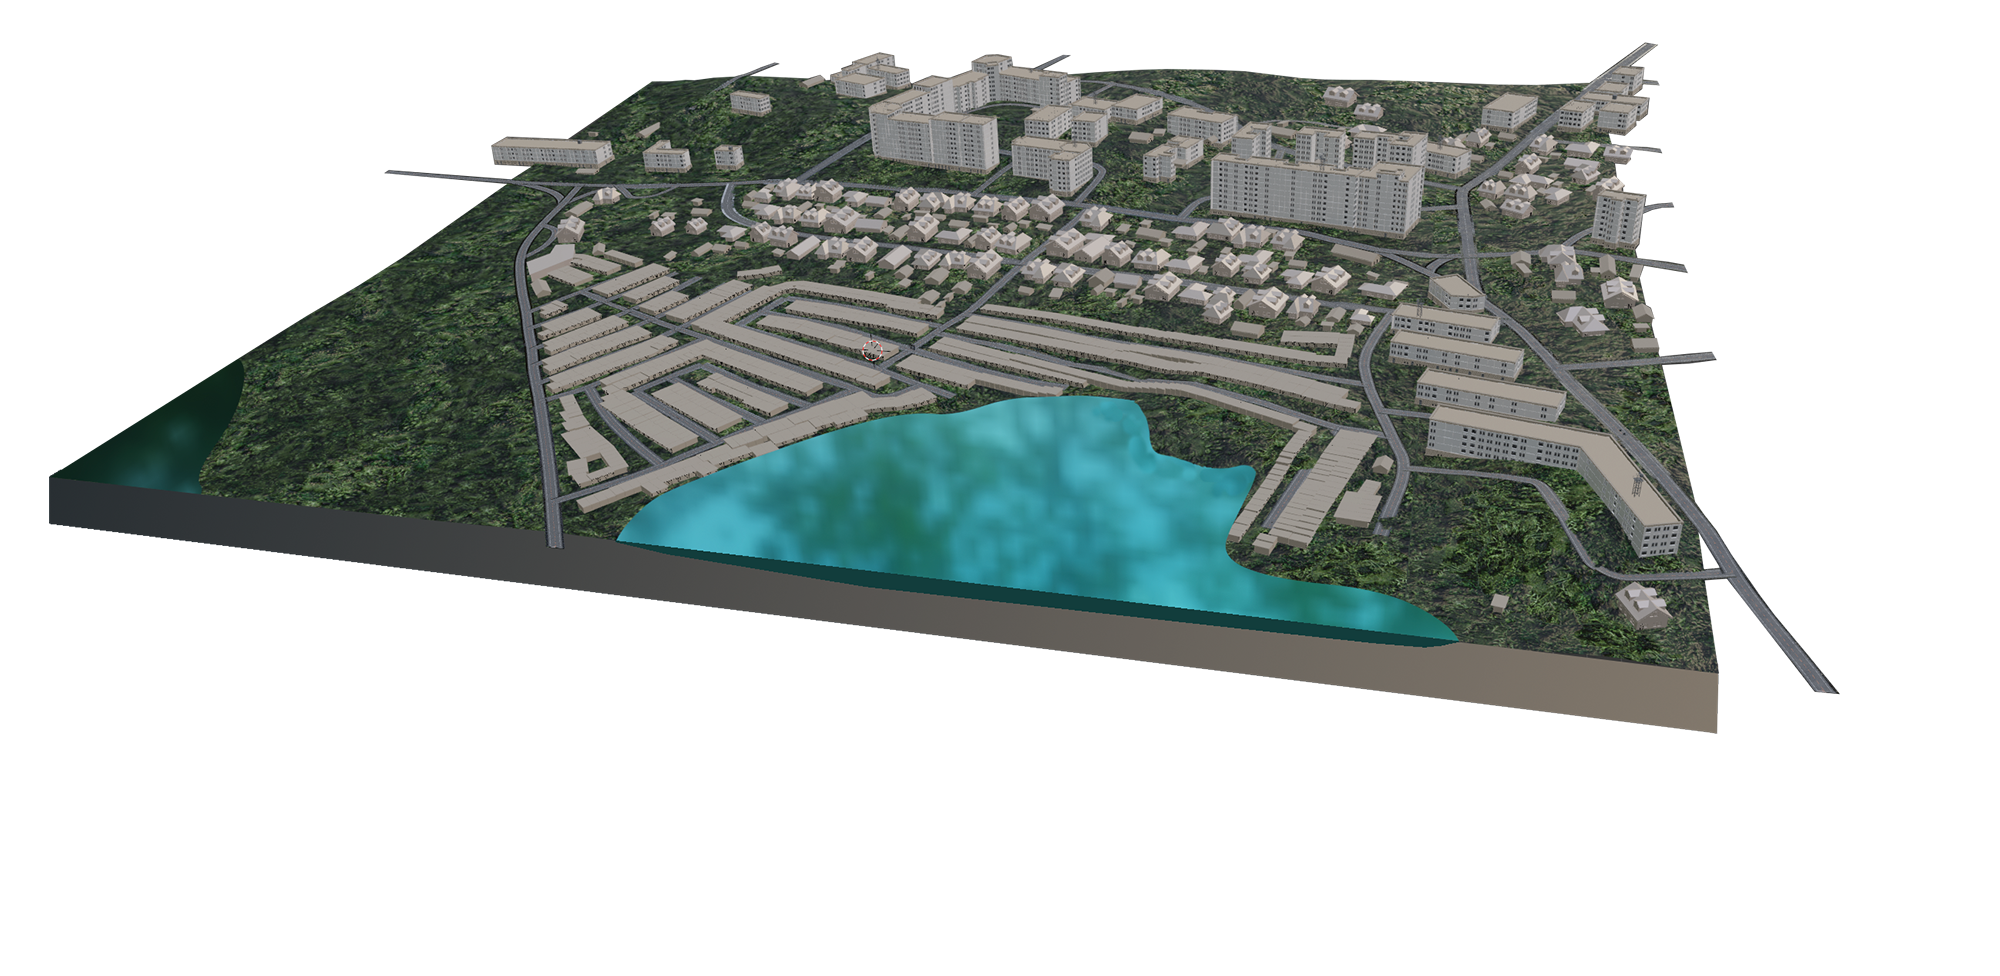
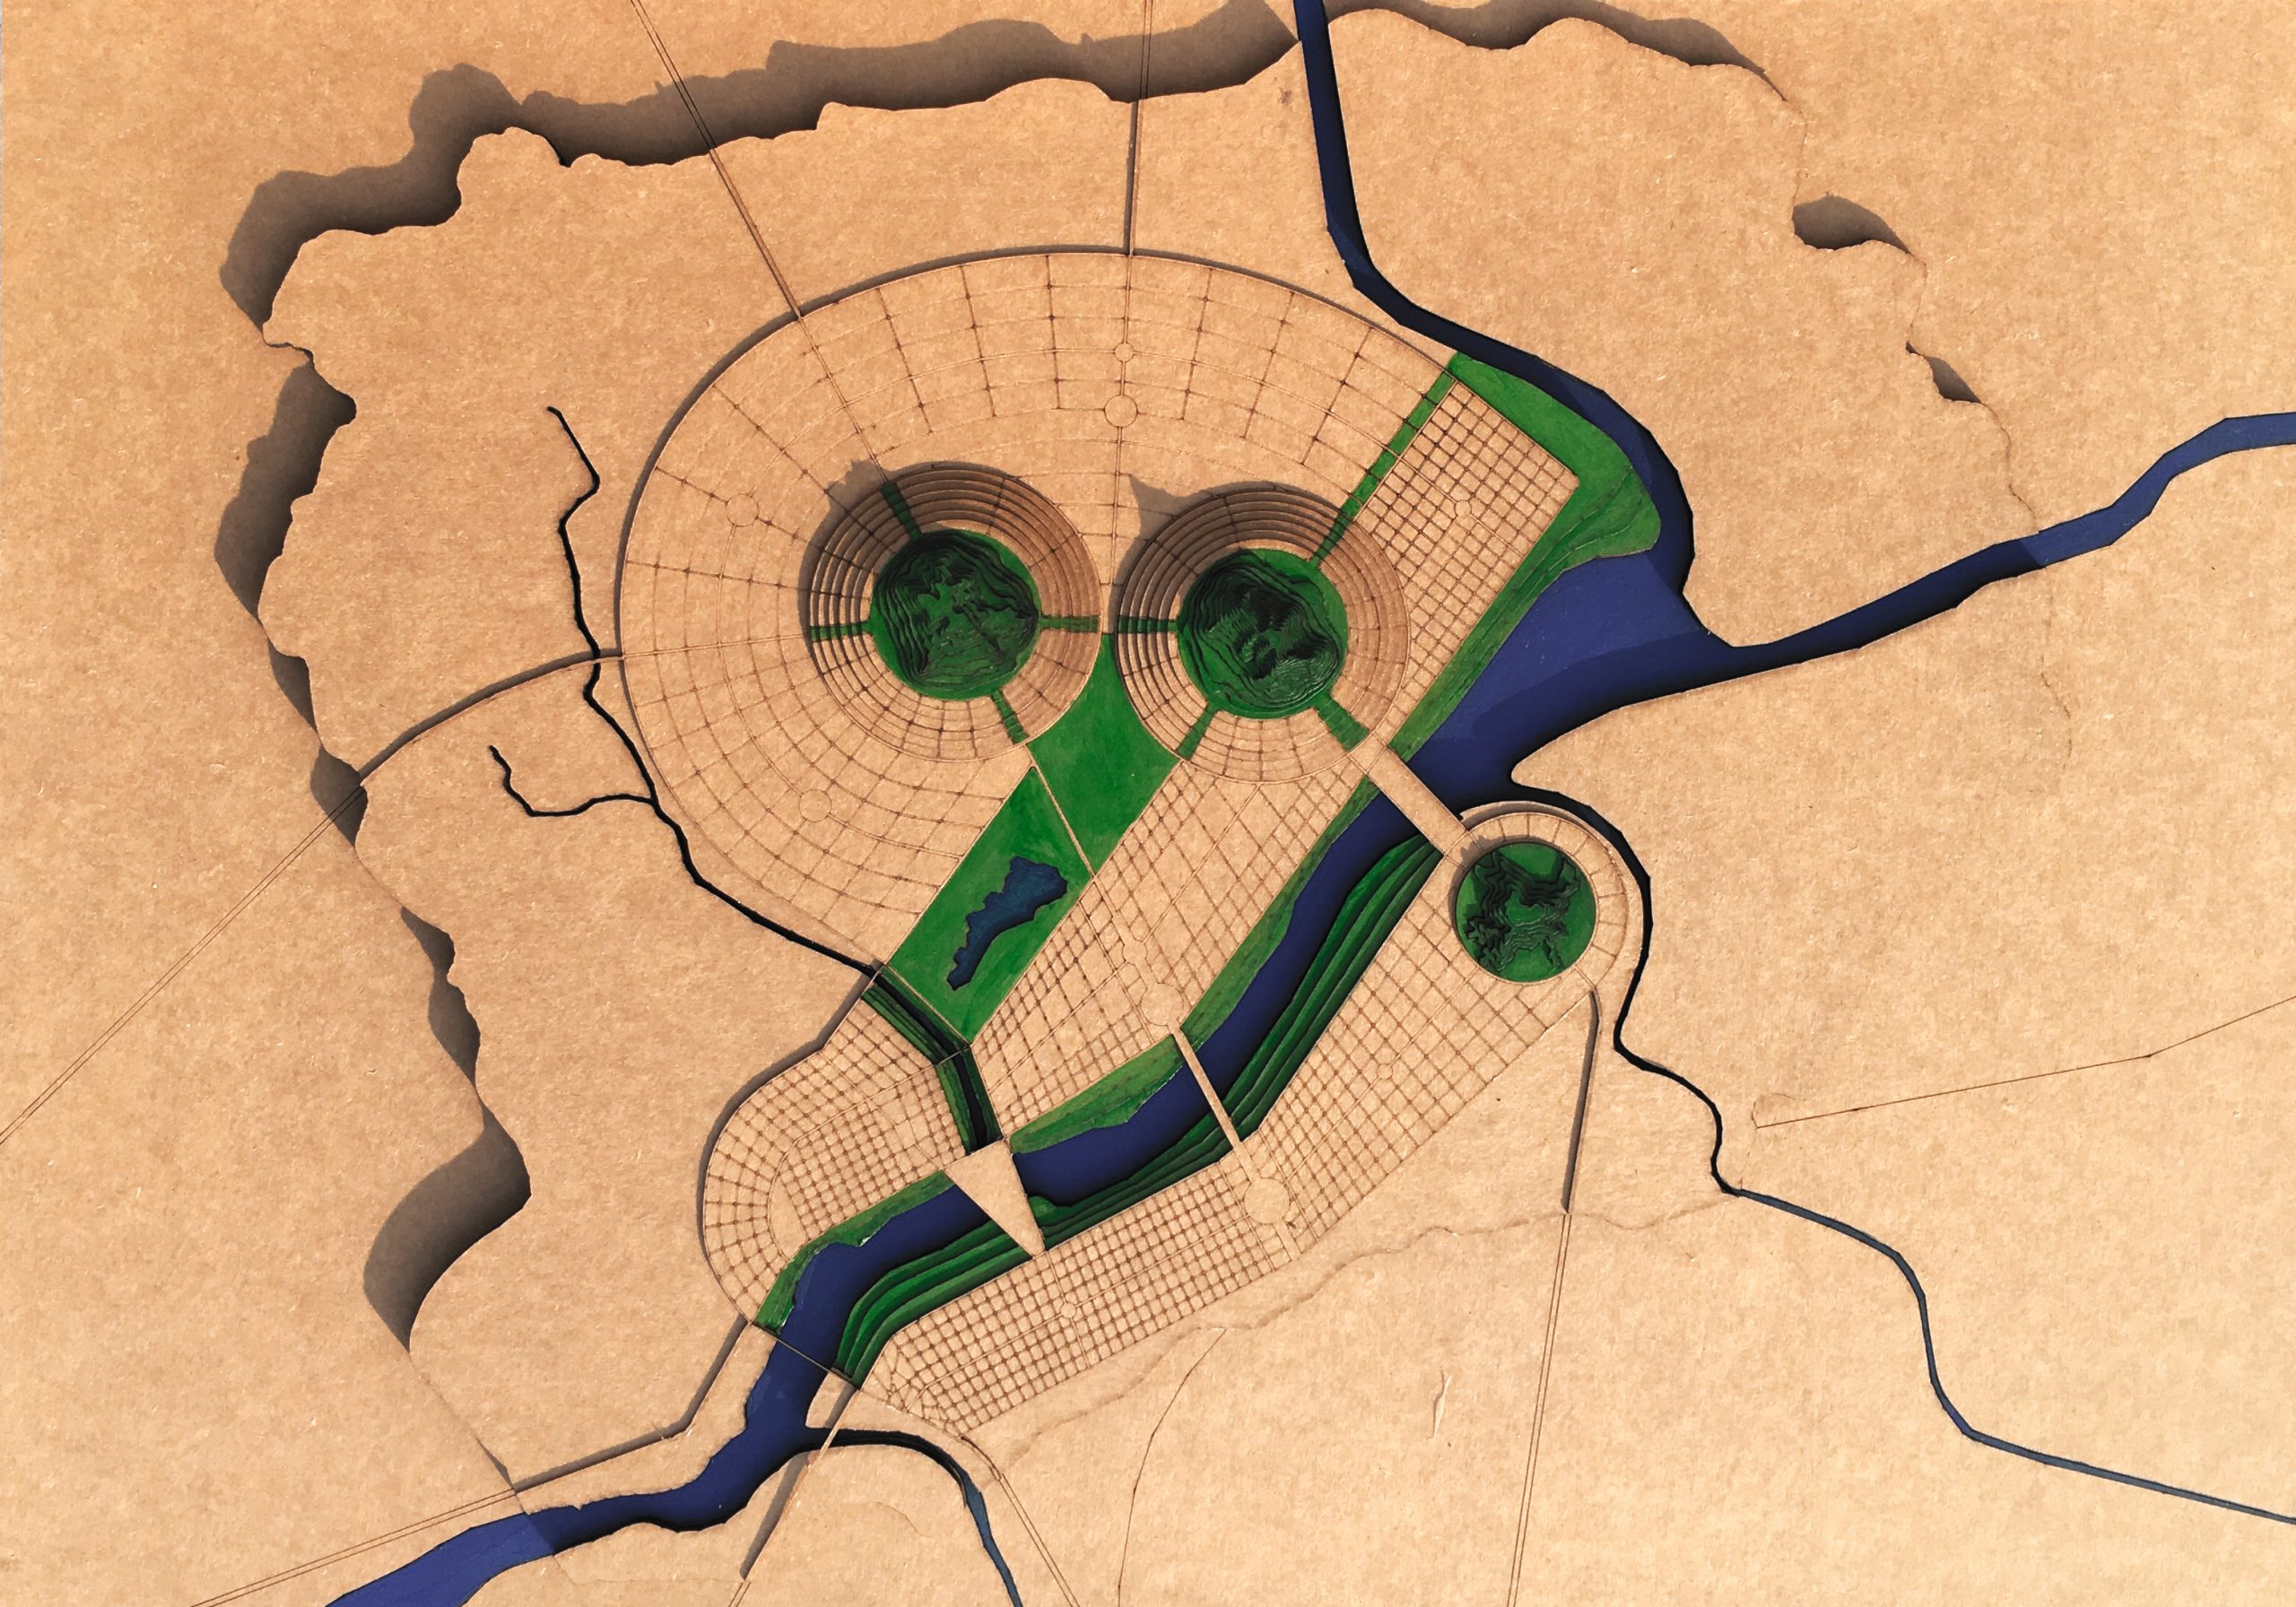
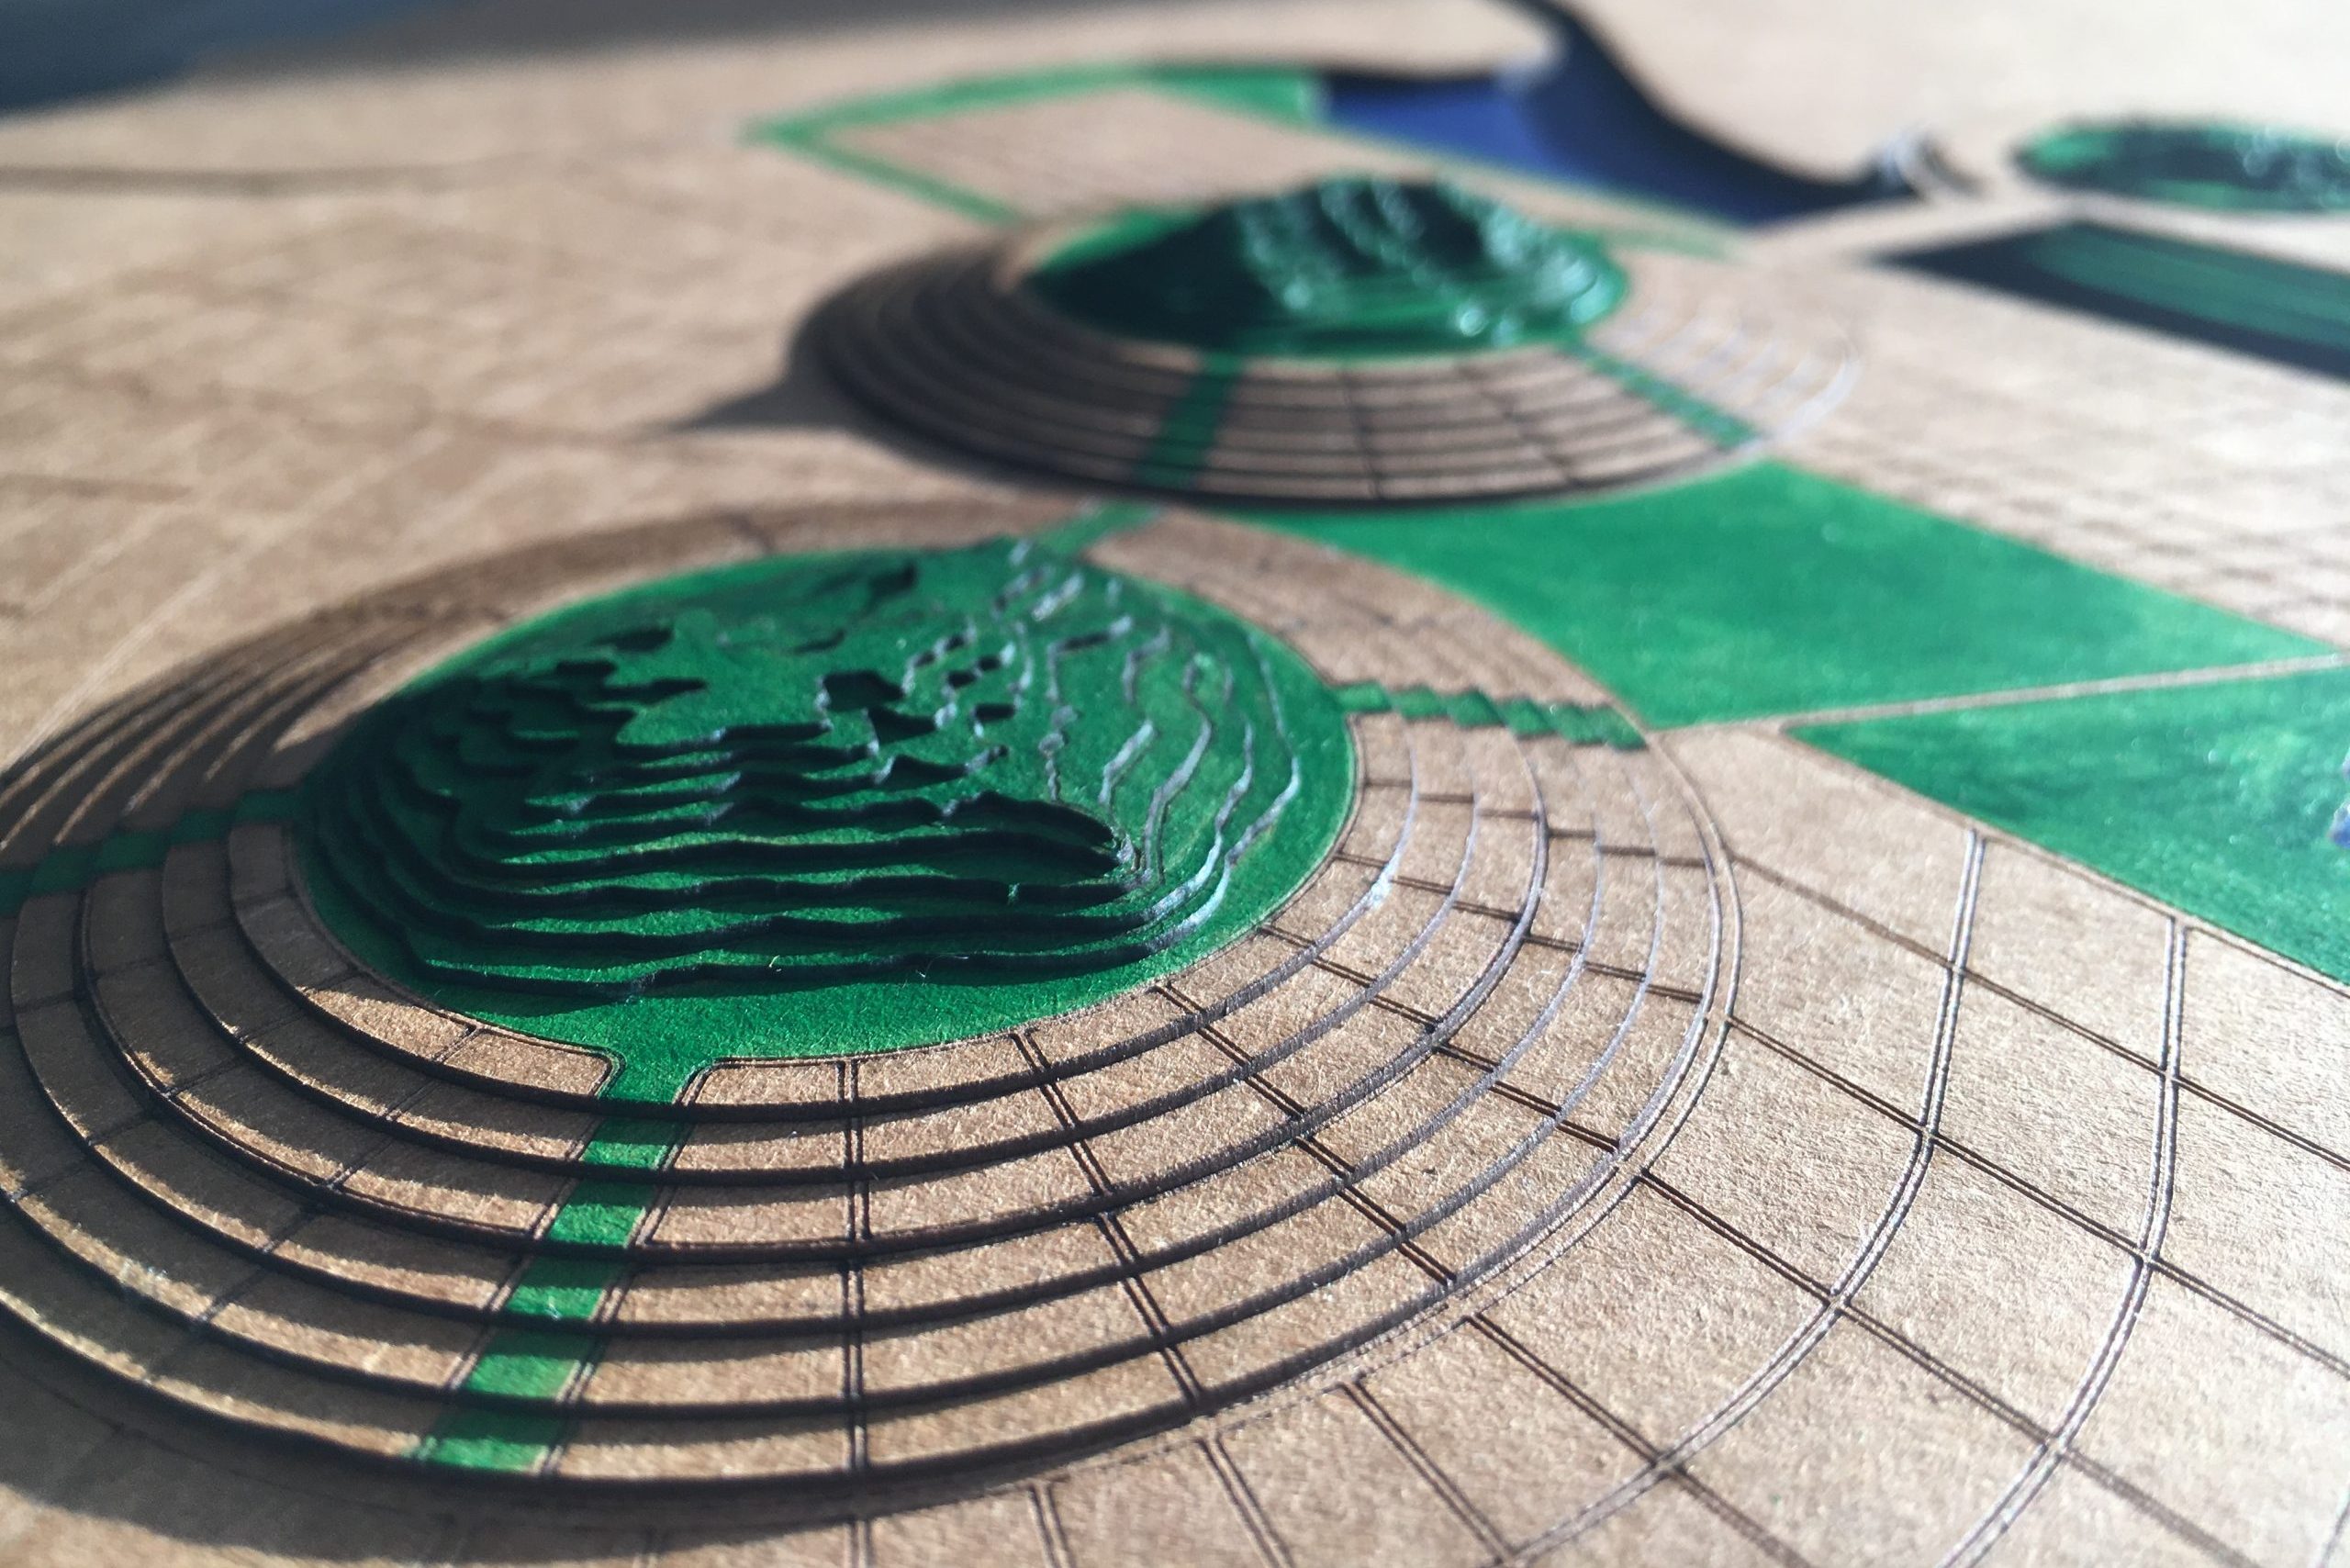
I showed you how I applied geometry nodes modifier to one district in Irpin. It would also work for other cities that face similar challenges. Needless to say, it is possible to use this script at any context, be it artificial or existing, as long as the user is aware of its limitations and provides required inputs.
Adaptability
House geometry for detached and row typology, as well as wall modules for block typology is not being created by the code, but is being referenced from asset collections. This way, it is easy to change the design, without having to rewrite the code. One can simply exchange existing 3D models for preferred ones or edit existing meshes via modelling tools.
Intelligibility
You don´t have to be a geometry nodes expert to be able to use the tool. All the input sockets are clearly labelled and all the control options for variables are collected at the starting panel. You don´t have to dig deep into the code and look for the corresponding node.
Accessibility
You can download the tool for free. All you need to run it is Blender software, at least version 4.0, which is also free and open source. Thanks to instancing feature, running the script doesn´t use a lot of computer RAM, thus, a powerful machine with fancy indicators is not required. Any average laptop would do the job.
I know, that the tool I developed is not perfect and a lot can be done to make it even better. But the good thing about open source community is that anyone who is interested can contribute to the further development of this script and expand its capabilities.
Downloads
Click here to download a Blender file with Geometry Nodes setup for BSG (without a specific context), as well as an adaptable masterplan for Irpin (with context – Hostomel highway district).
P.S. While using the script, you will probably encounter several bugs and things that don´t run smoothly. Please feel free to correct them if you know how and if you do, contact me please. I am eager to share my experience and knowledge, as well as learning from other open source enthusiasts!